All
All
Stock
Crypto
Index
Currency
Future
Result
English
Français
Español
Português
Русский
中文
Deutsch
日本語
العربية
한국어
Türkçe
हिन्दी
Svenska
Dansk
Norsk
Suomi
Nederlands
Italiano
فارسی
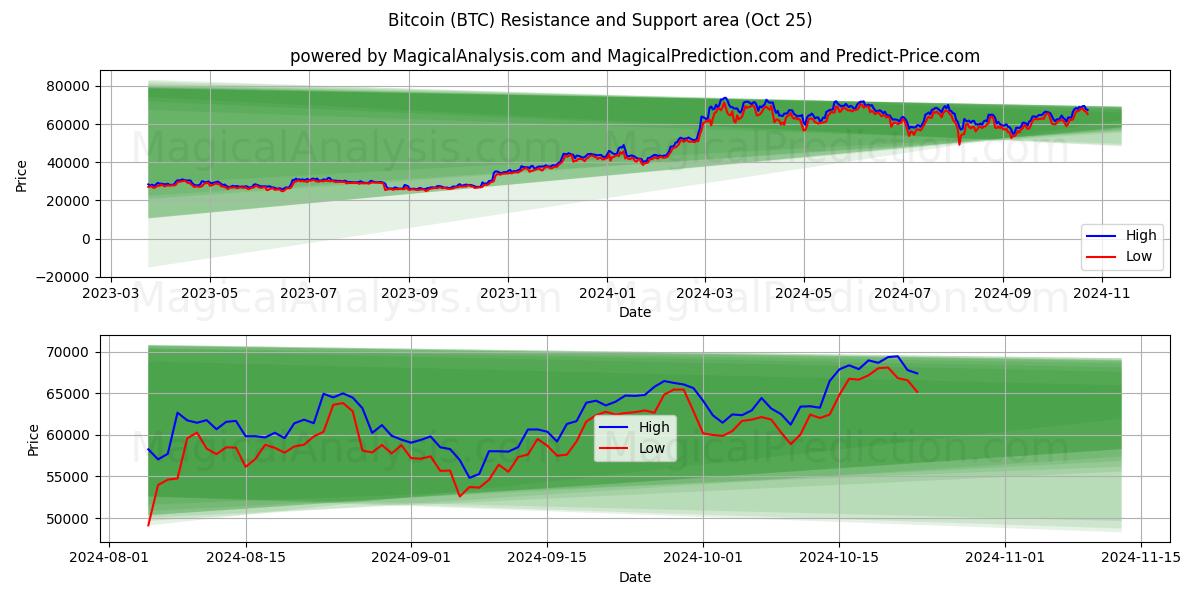
BTC
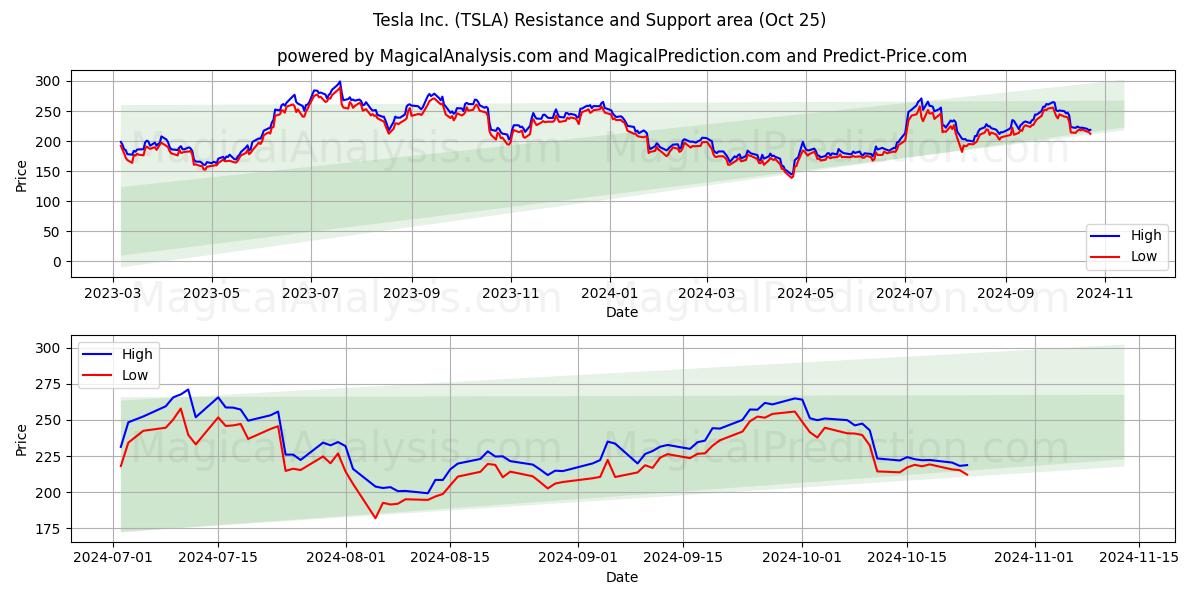
TSLA
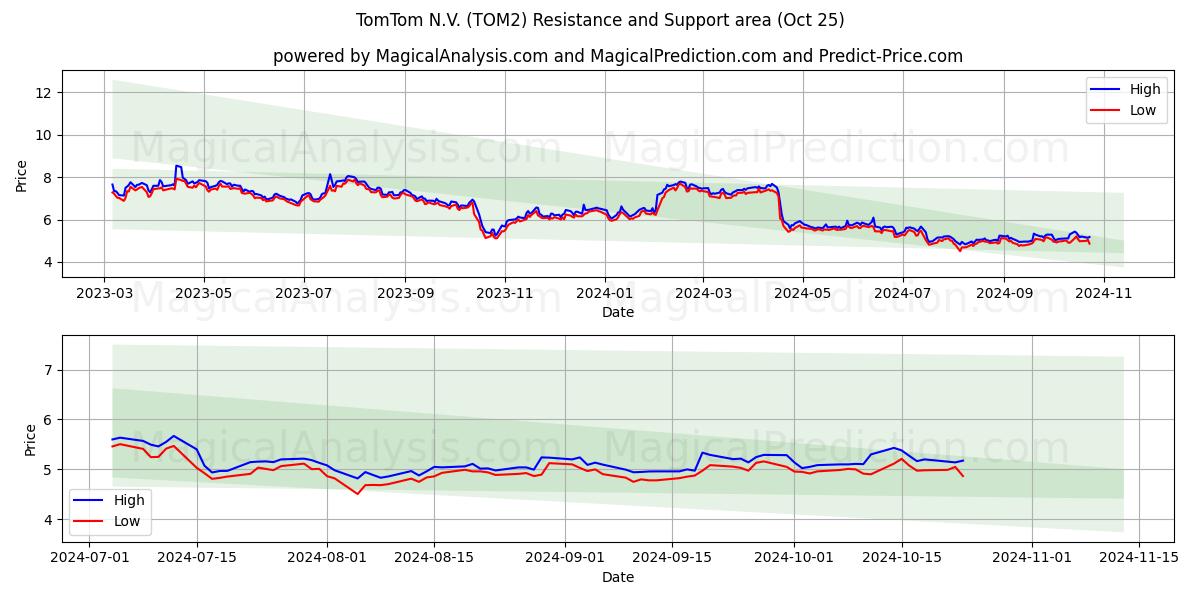
TOM2
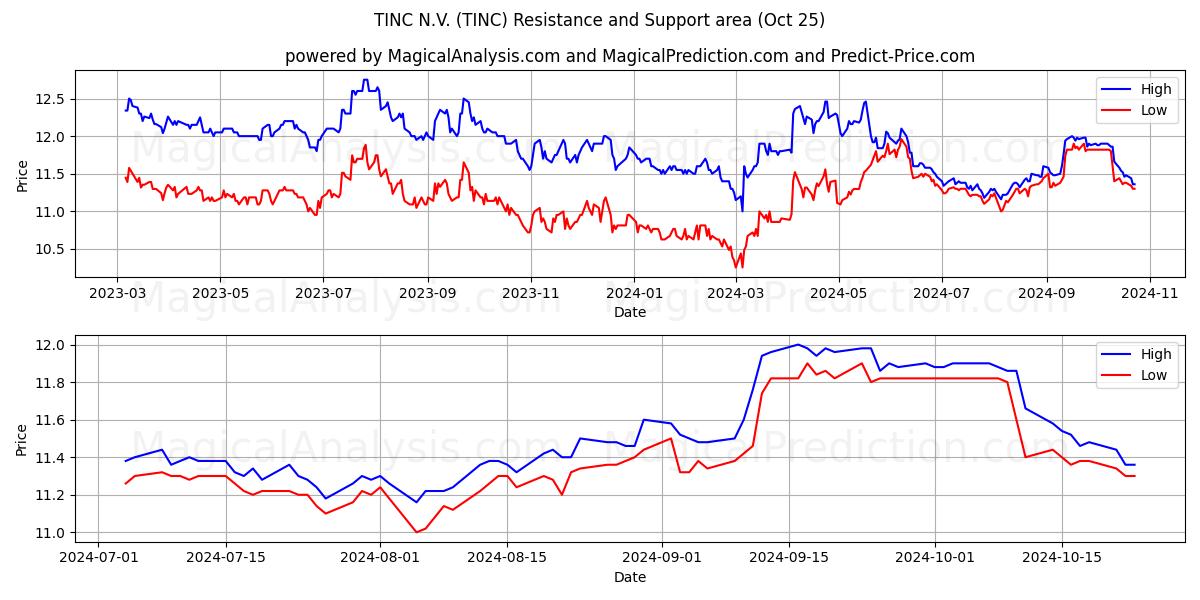
TINC
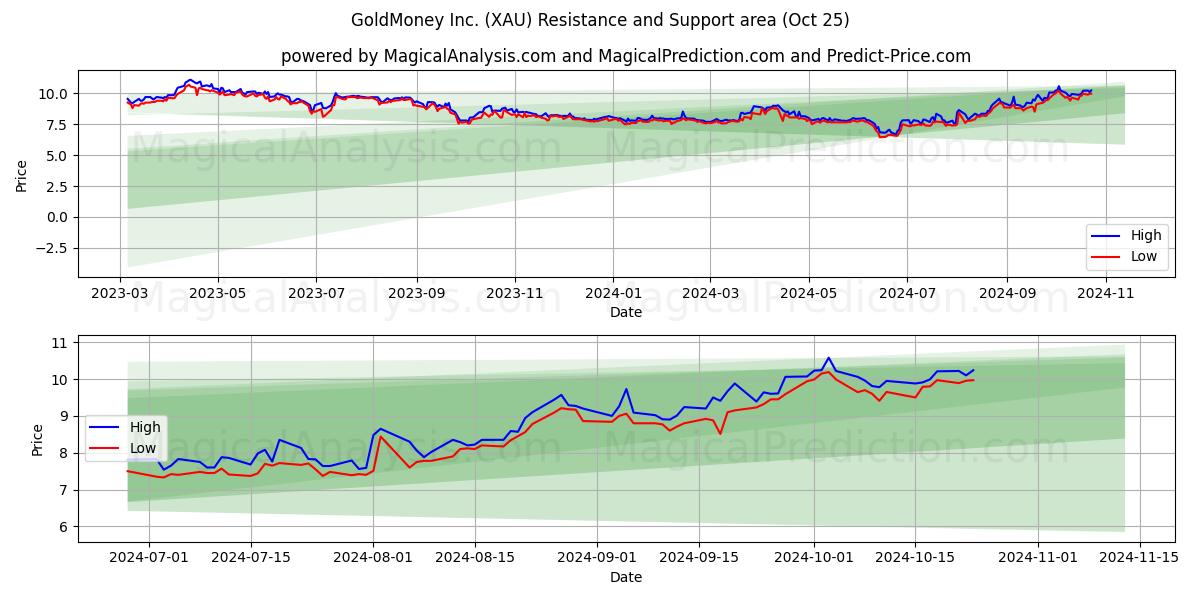
XAU
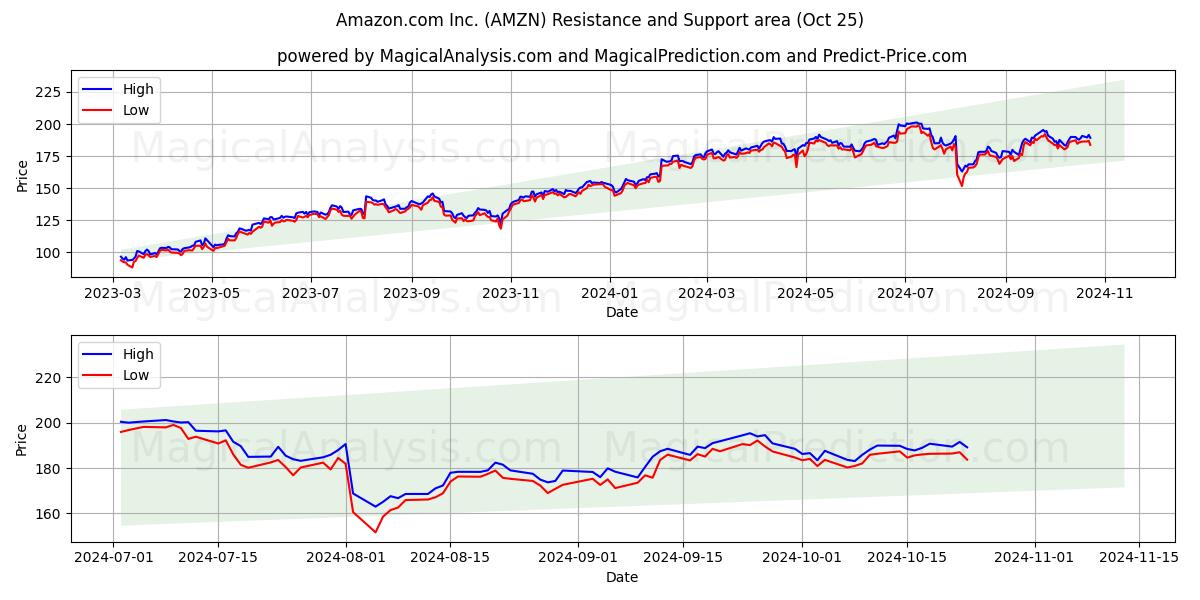
AMZN
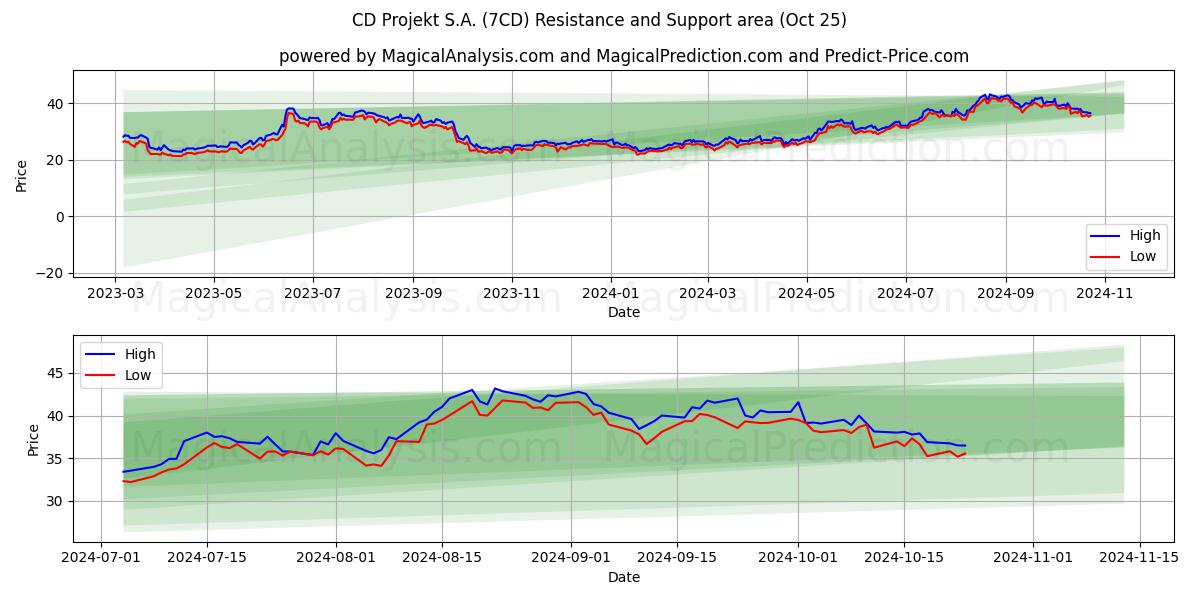
7CD
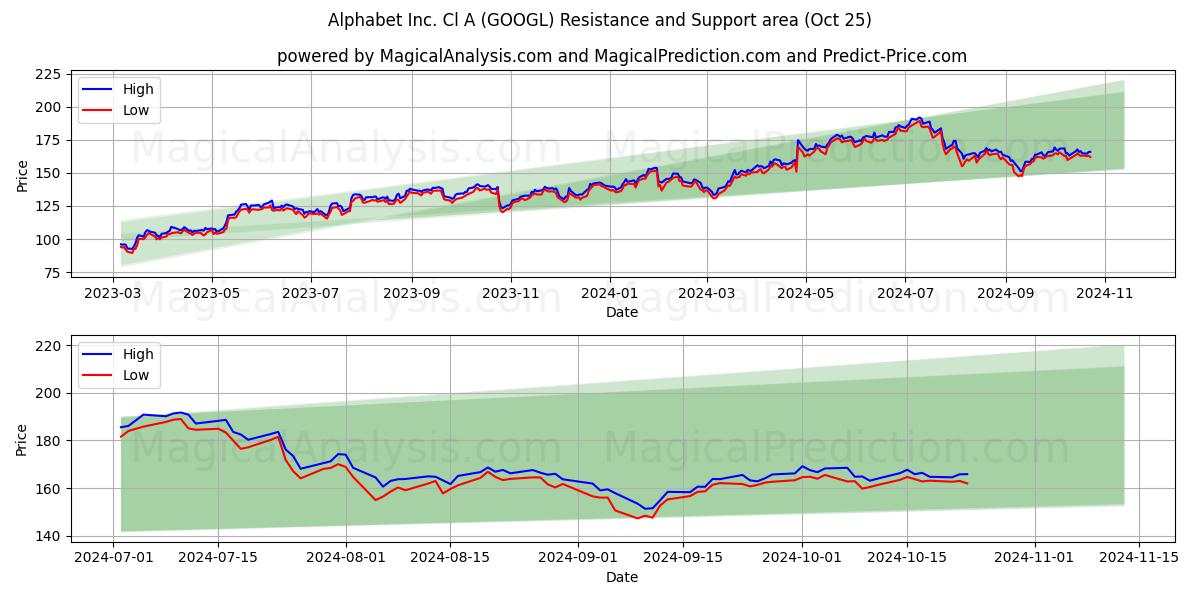
GOOGL
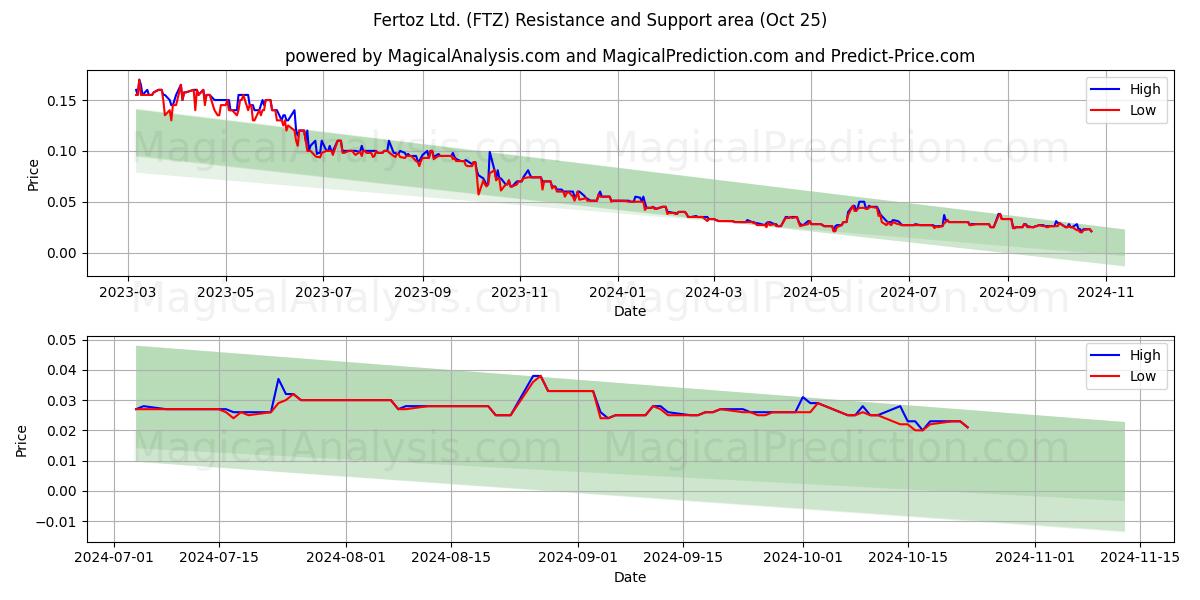
FTZ
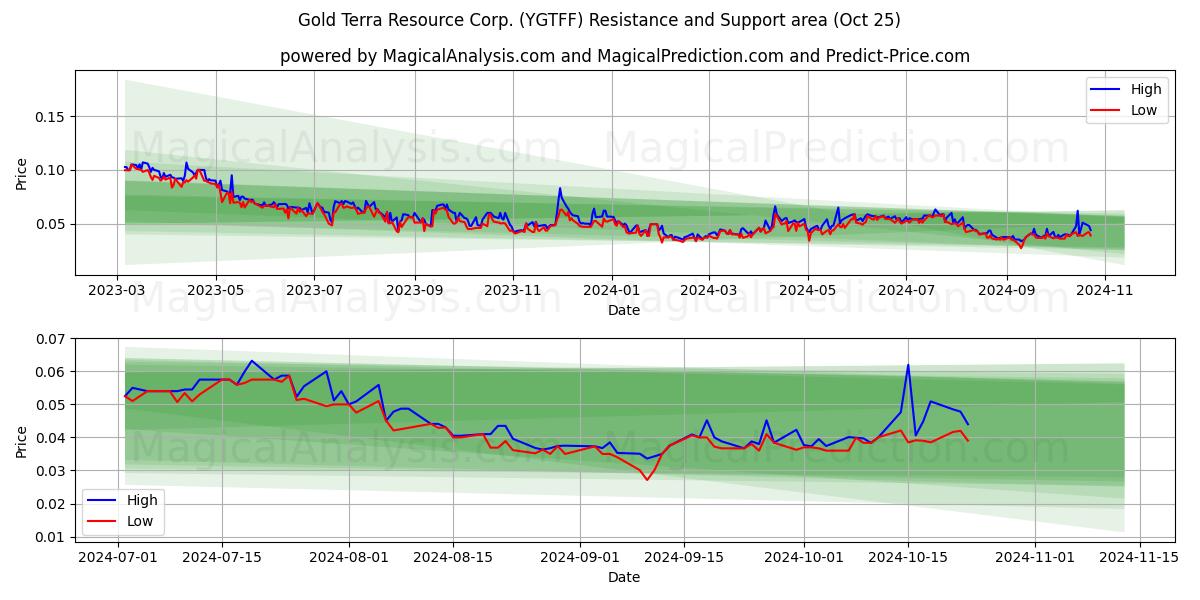
YGTFF
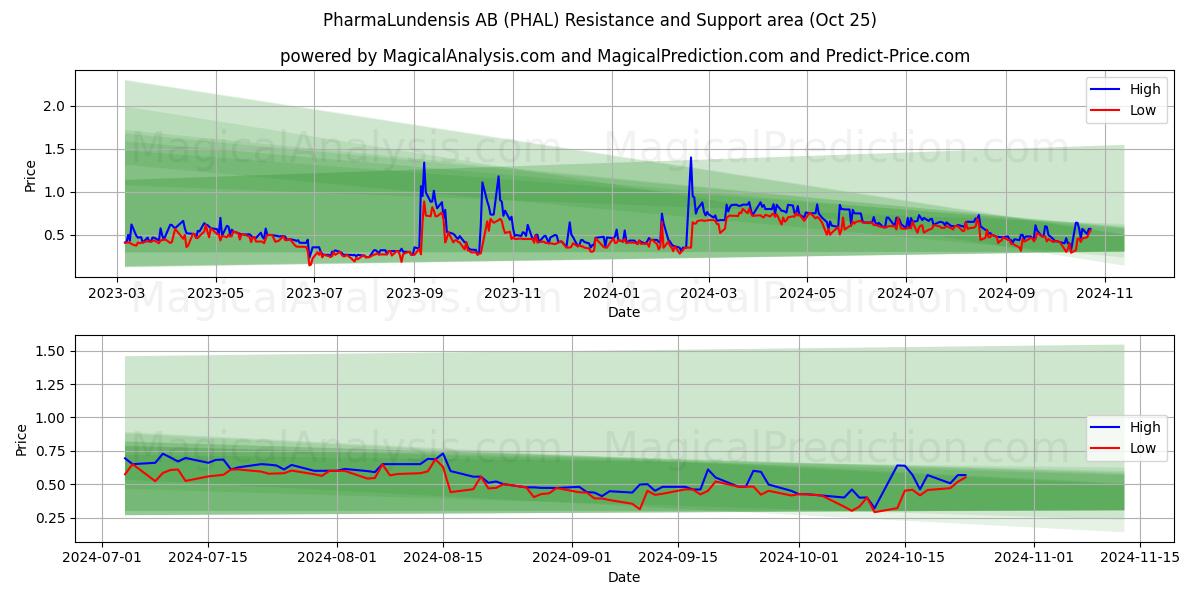
PHAL
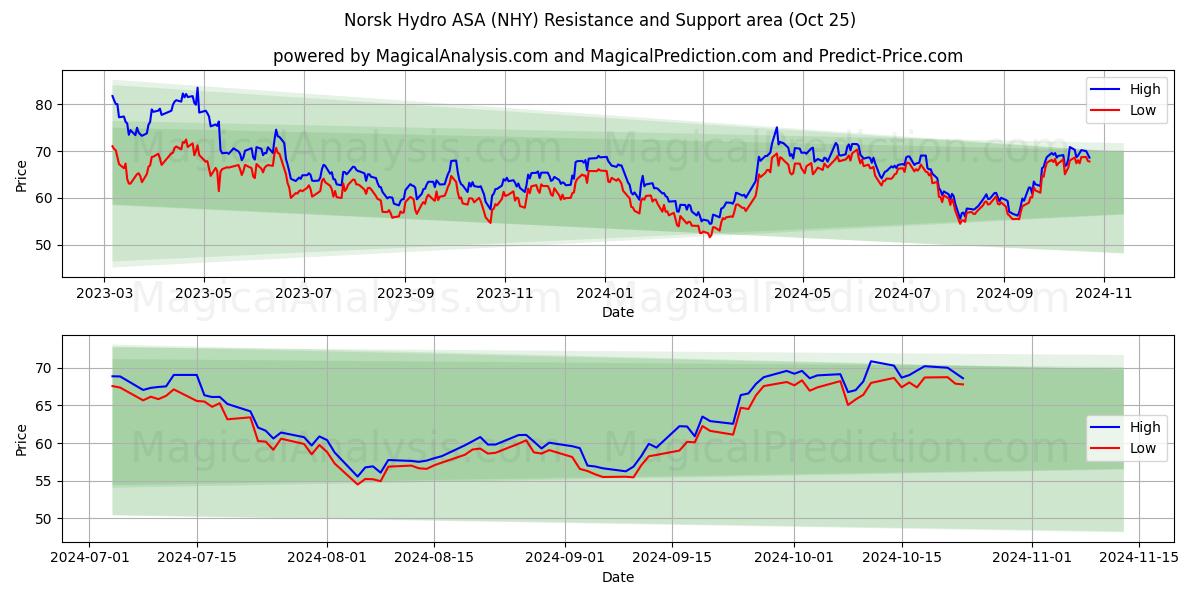
NHY
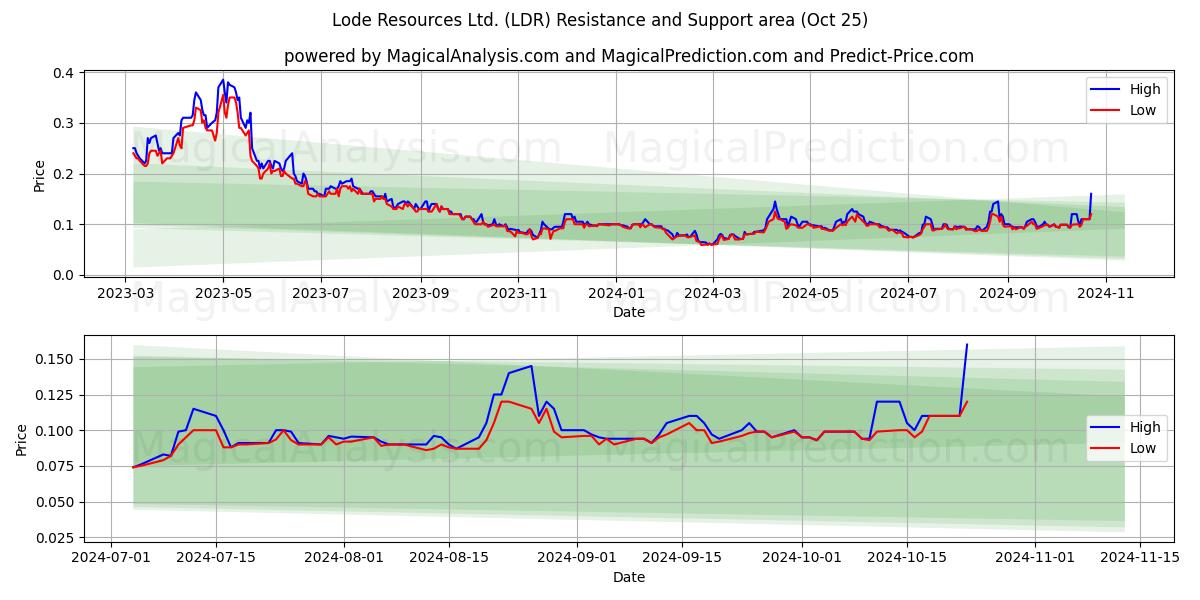
LDR
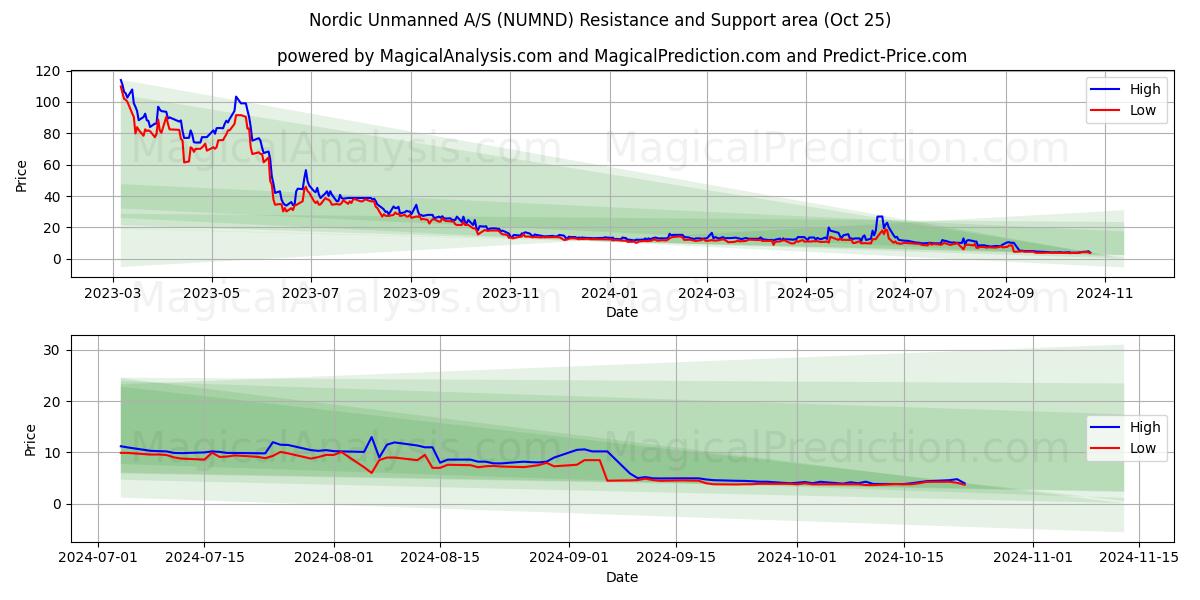
NUMND
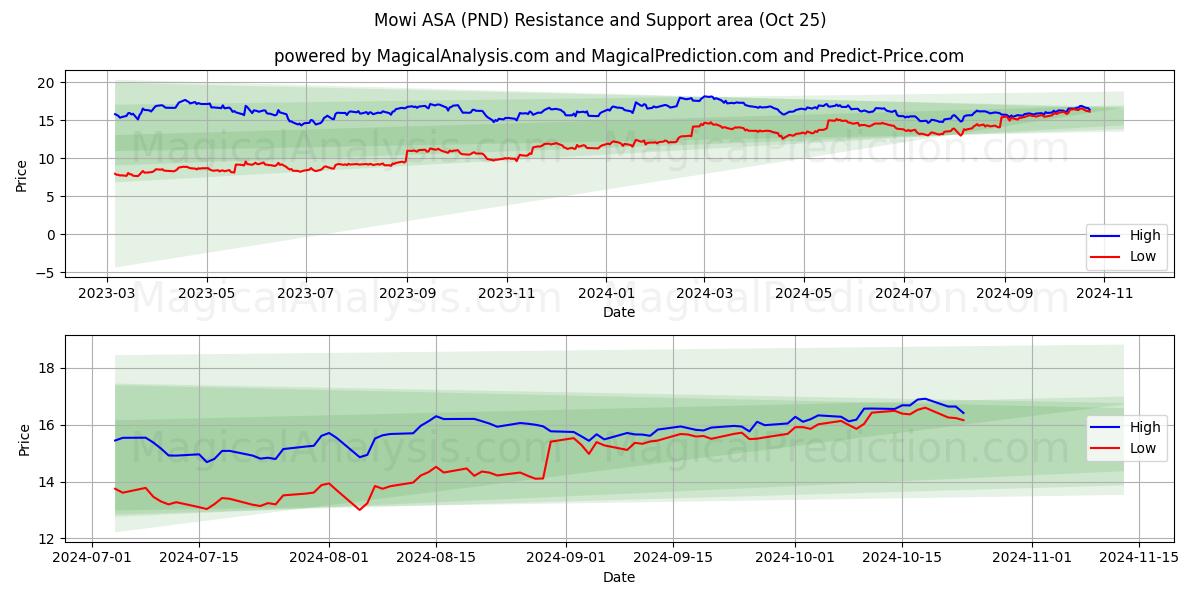
PND
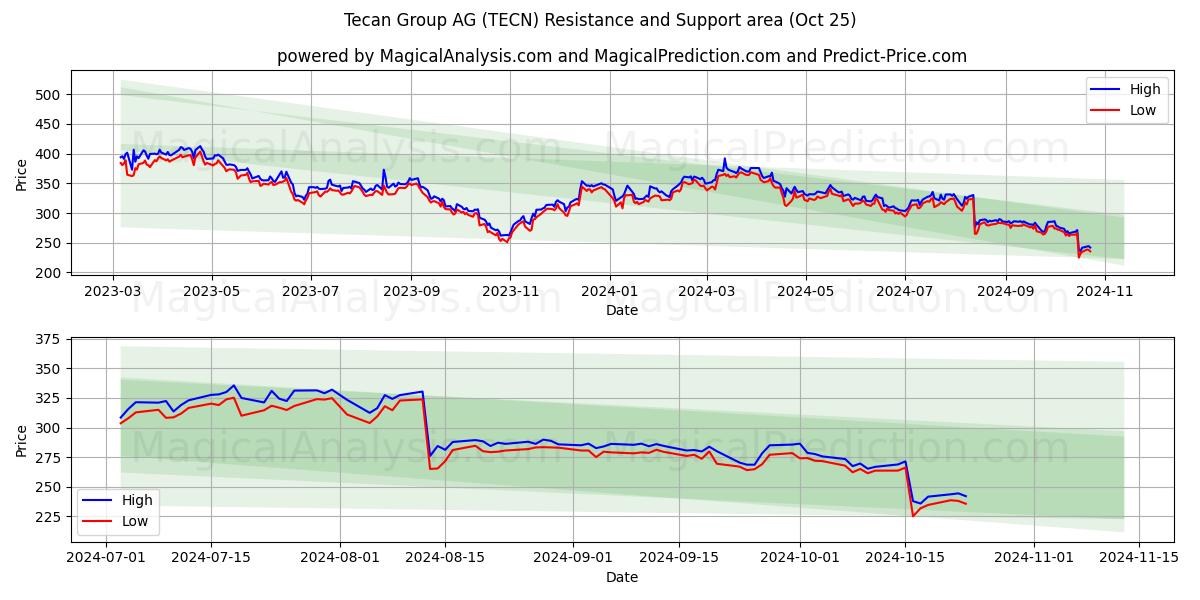
TECN
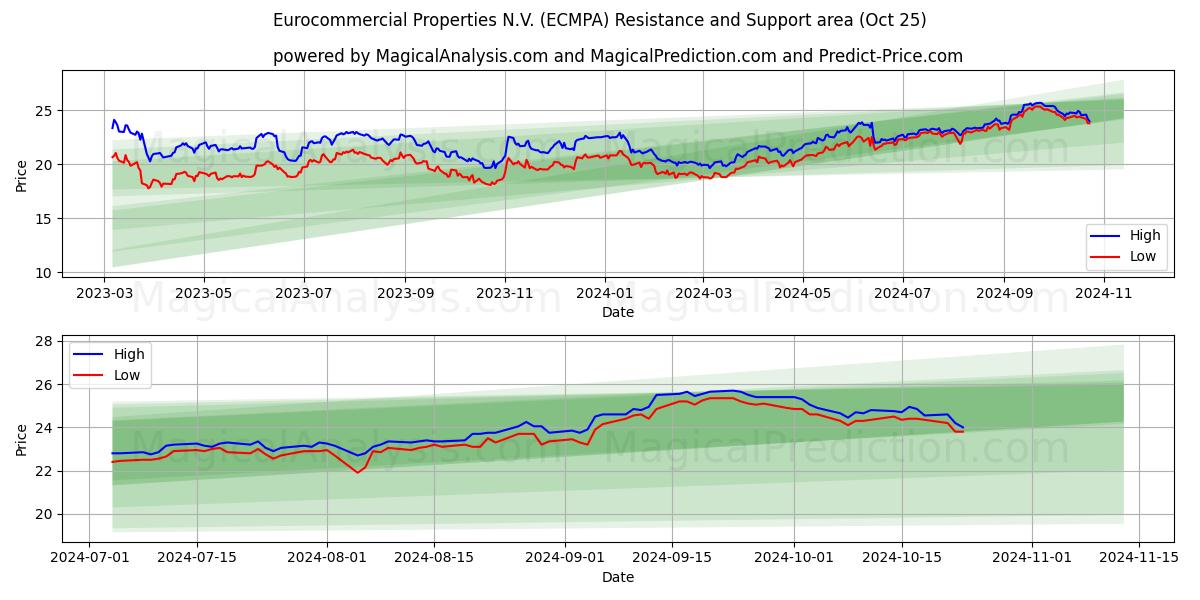
ECMPA
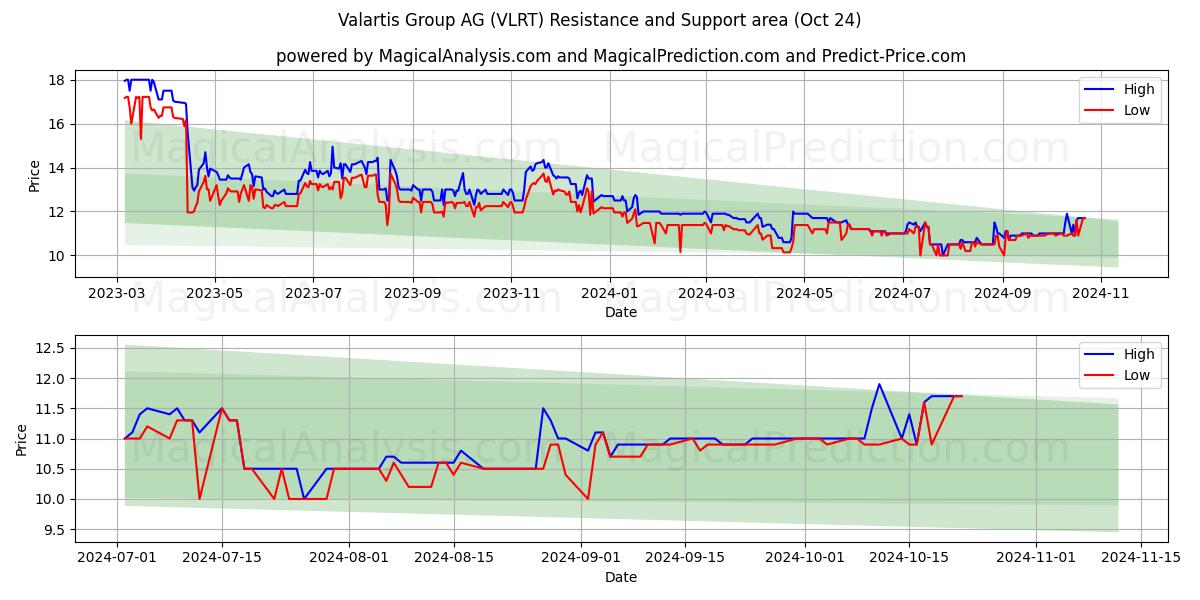
VLRT
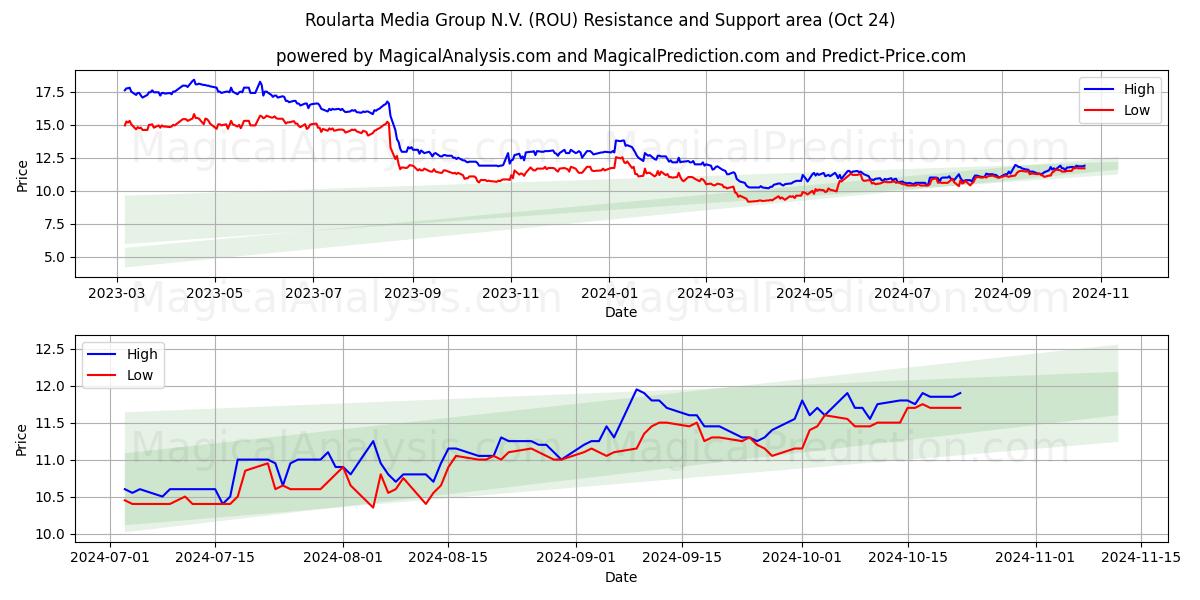
ROU
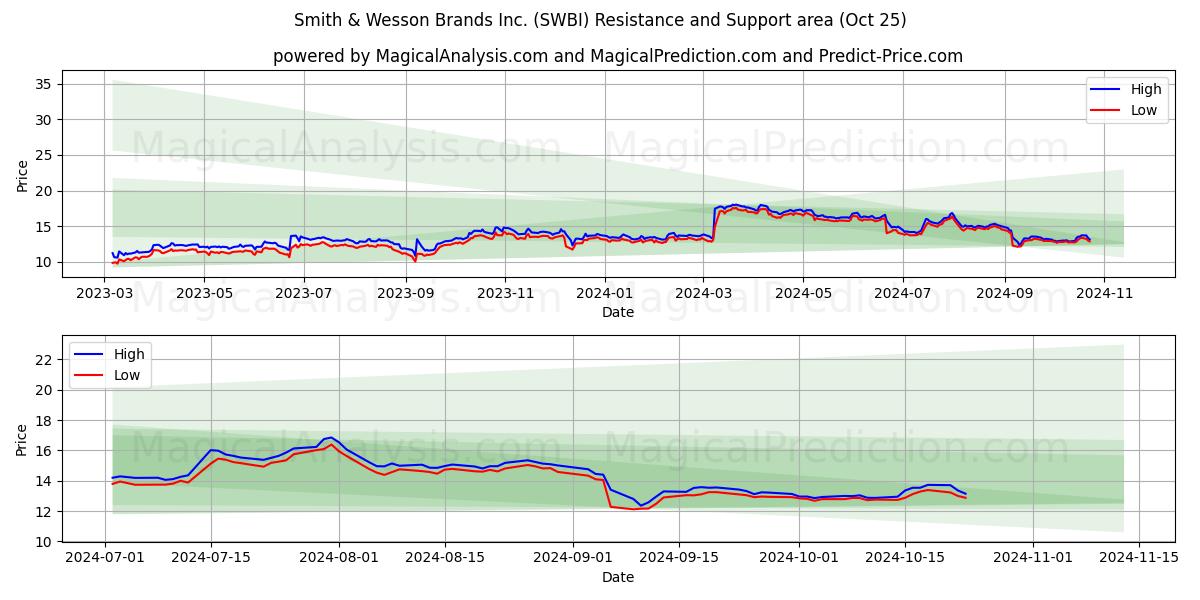
SWBI
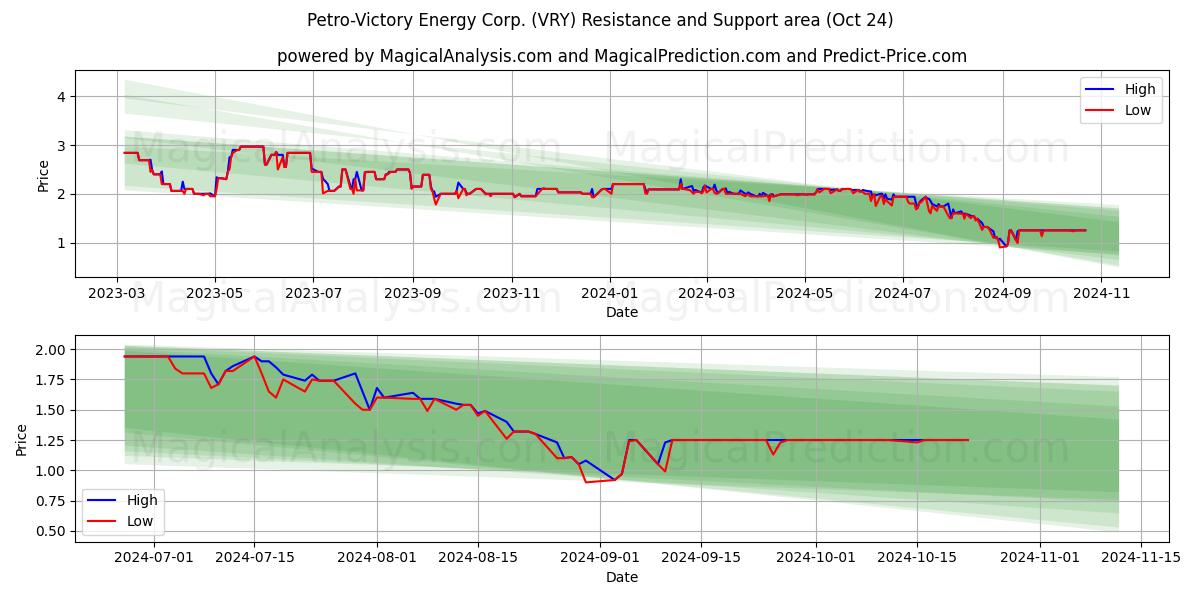
VRY
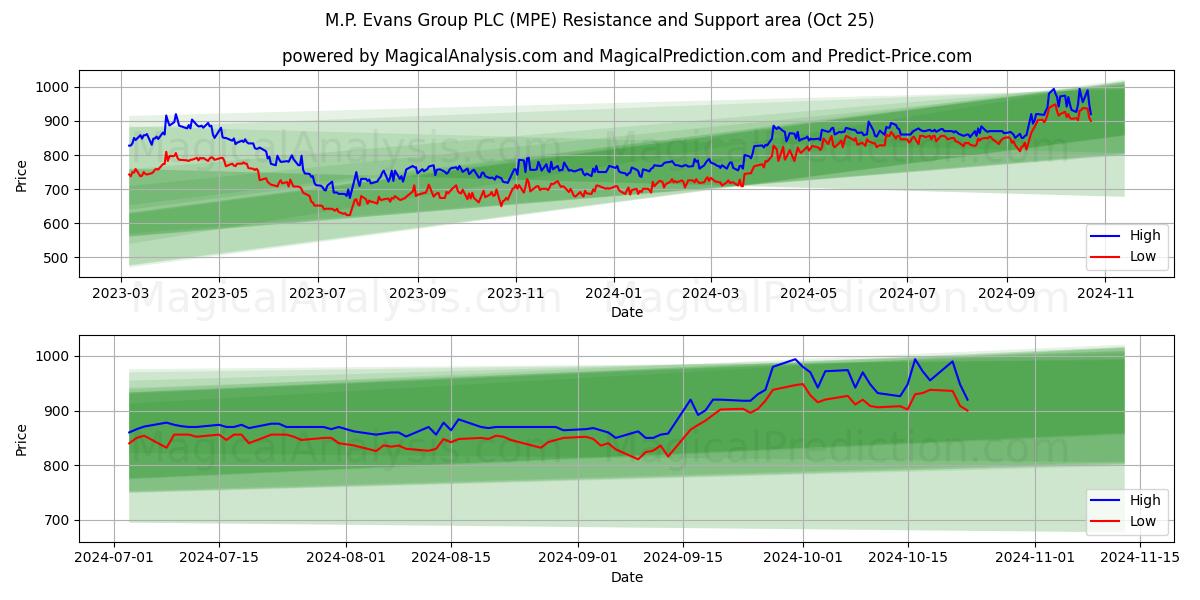
MPE
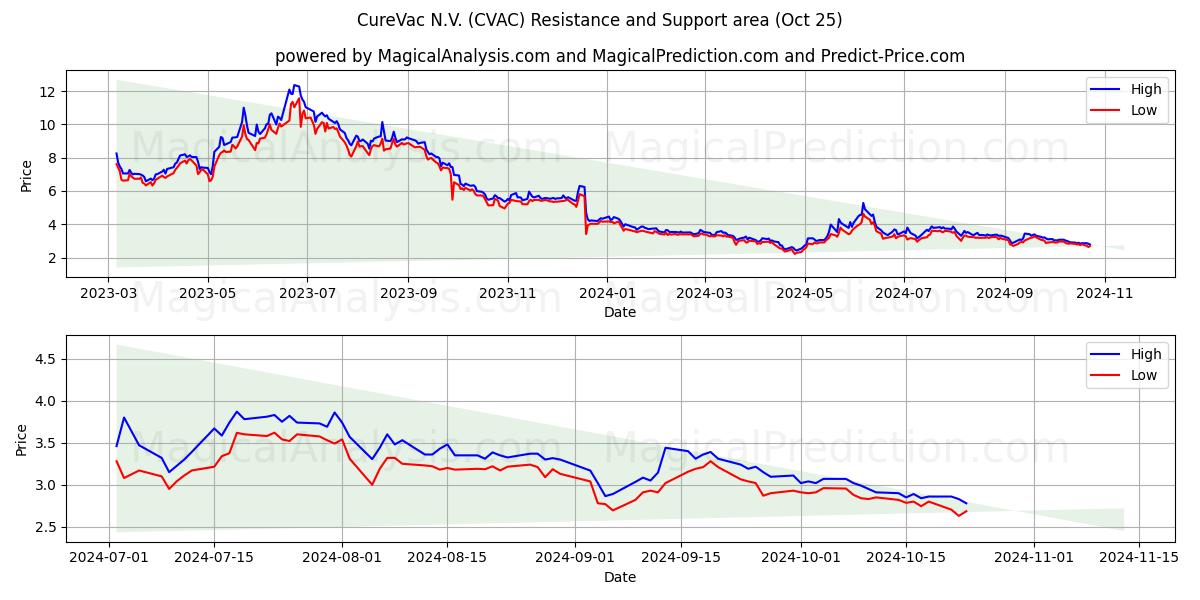
CVAC
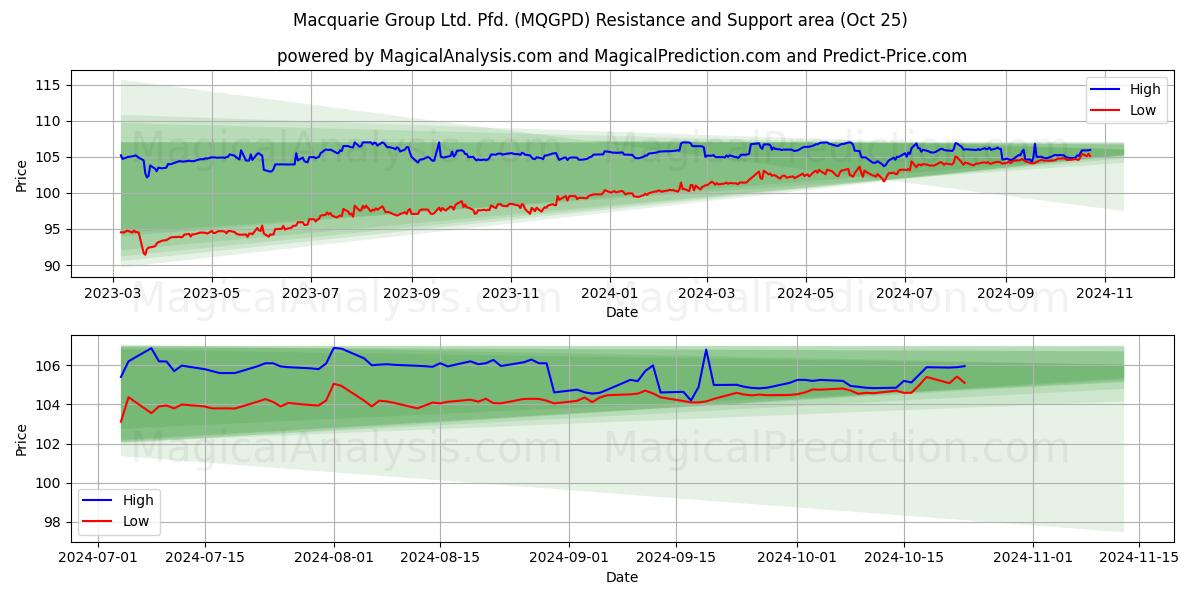
MQGPD
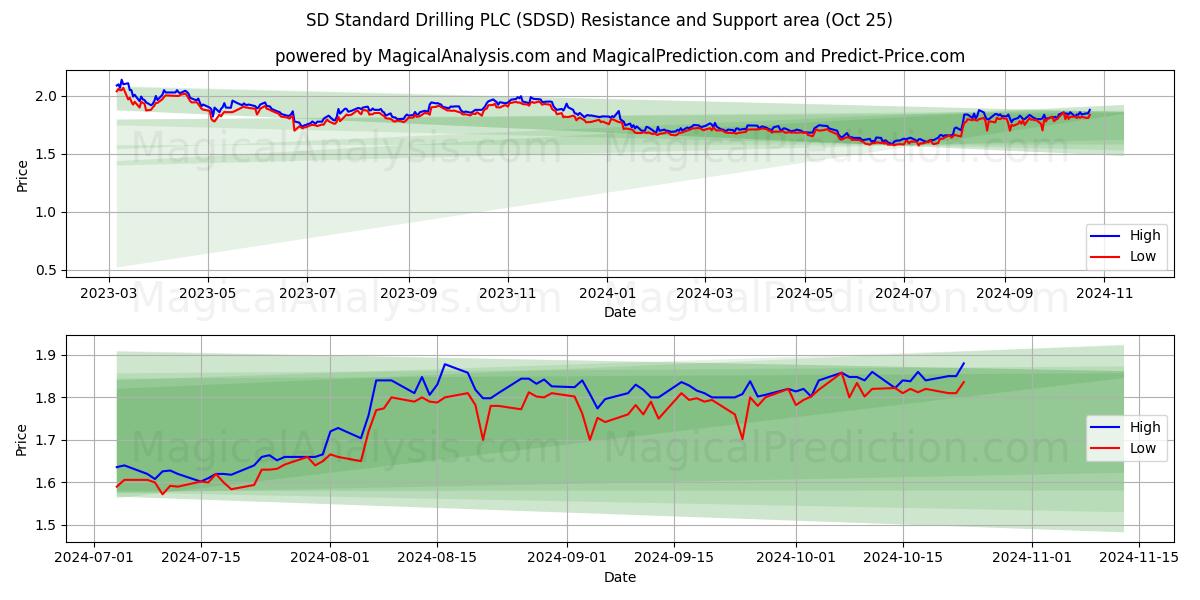
SDSD
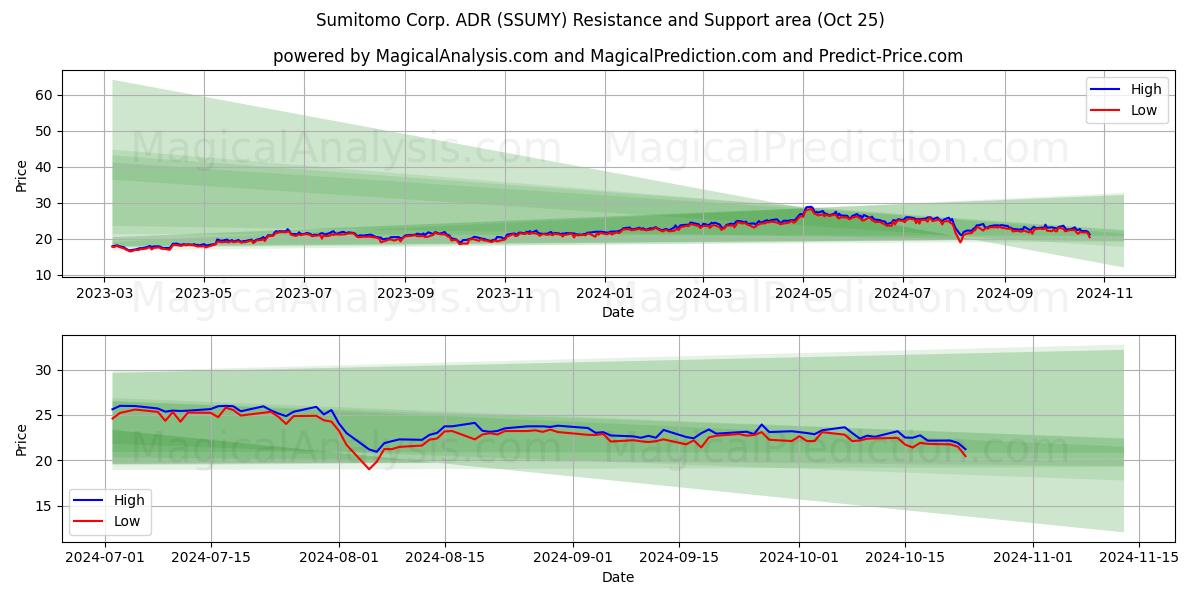
SSUMY
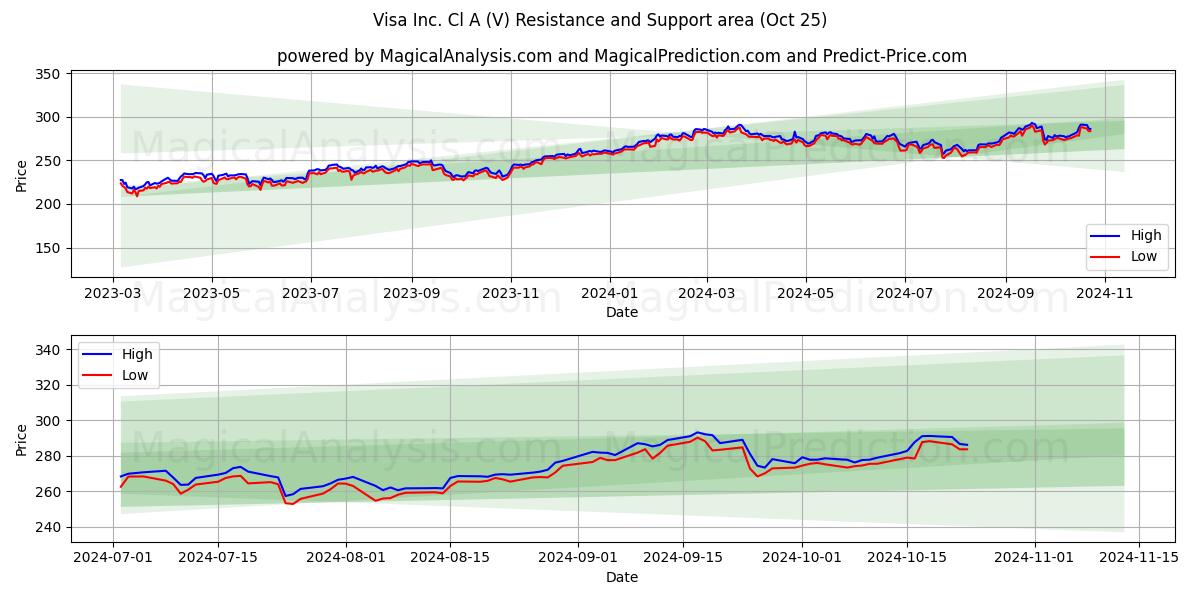
V
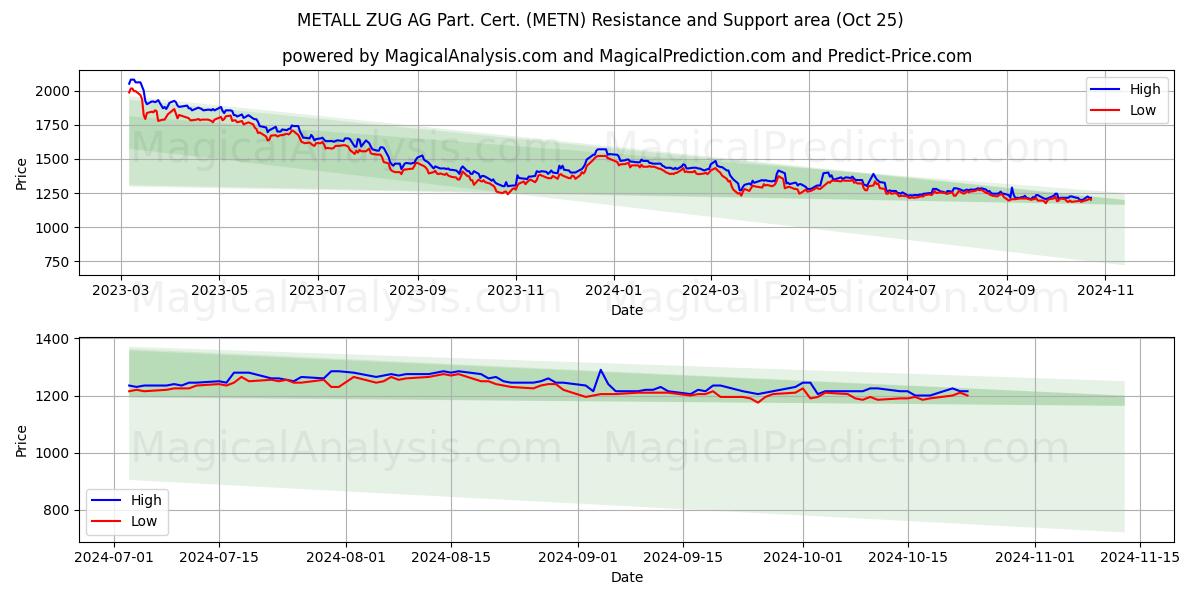
METN
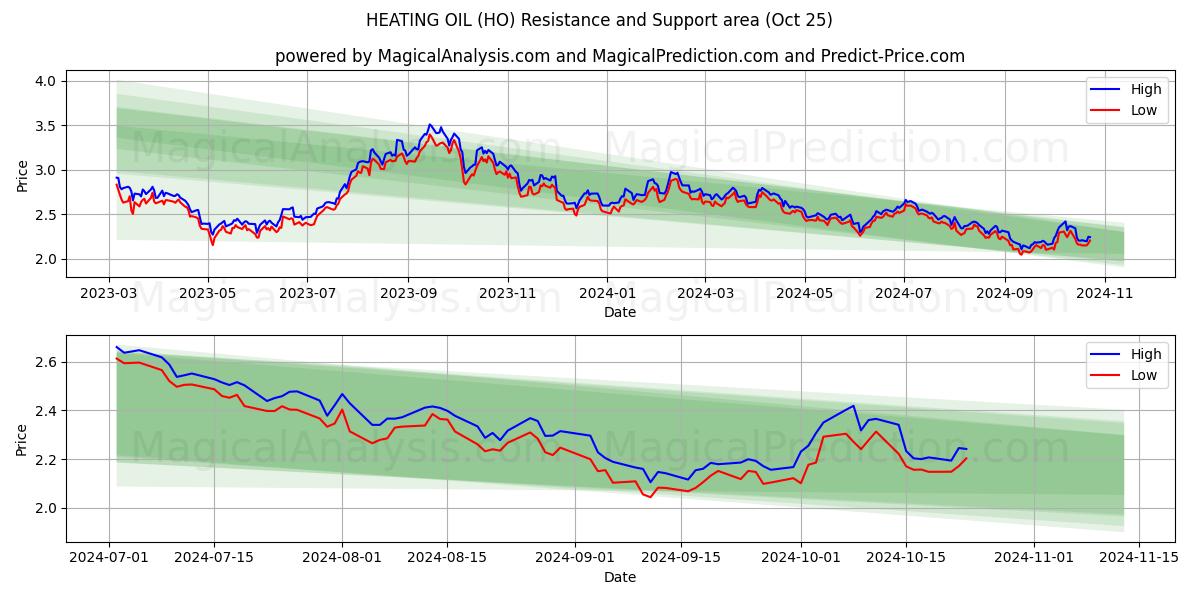
HO
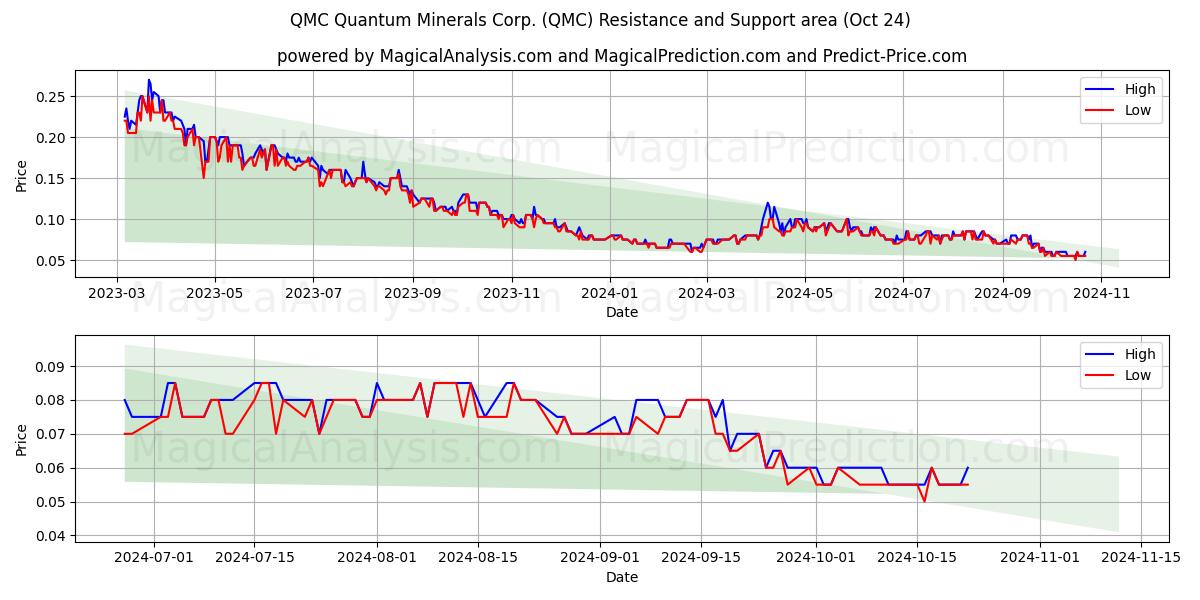
QMC
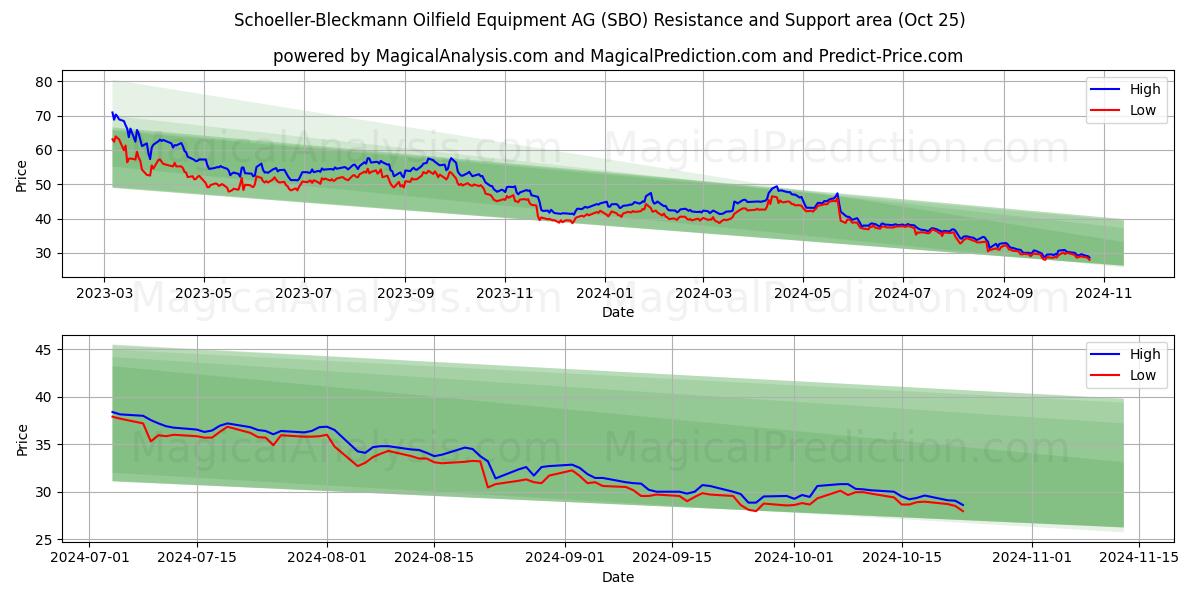
SBO
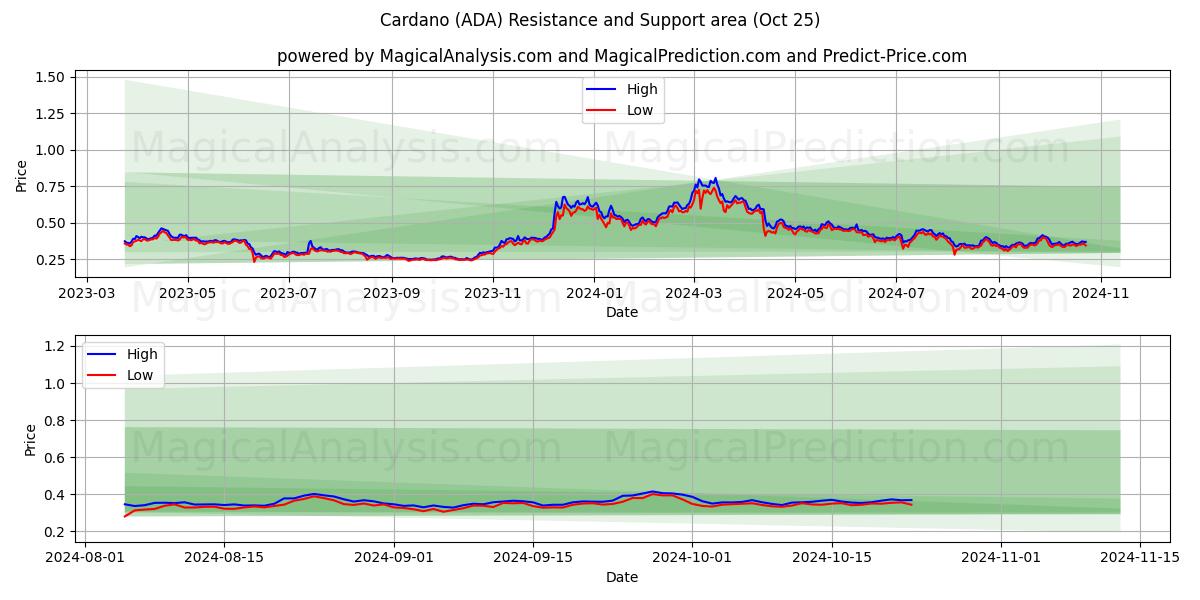
ADA
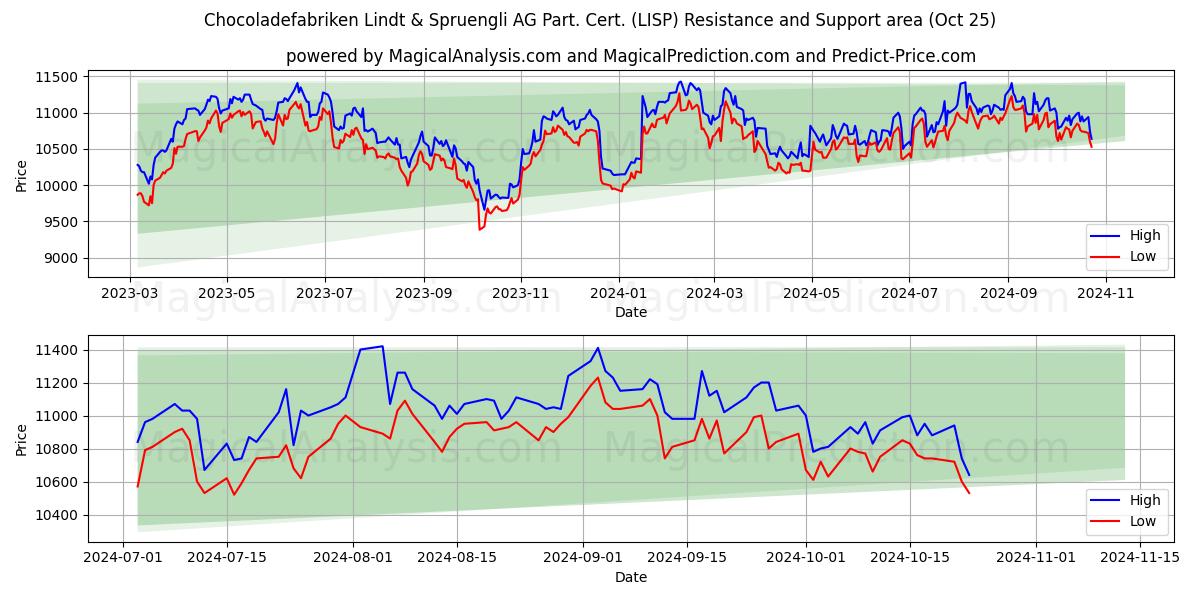
LISP
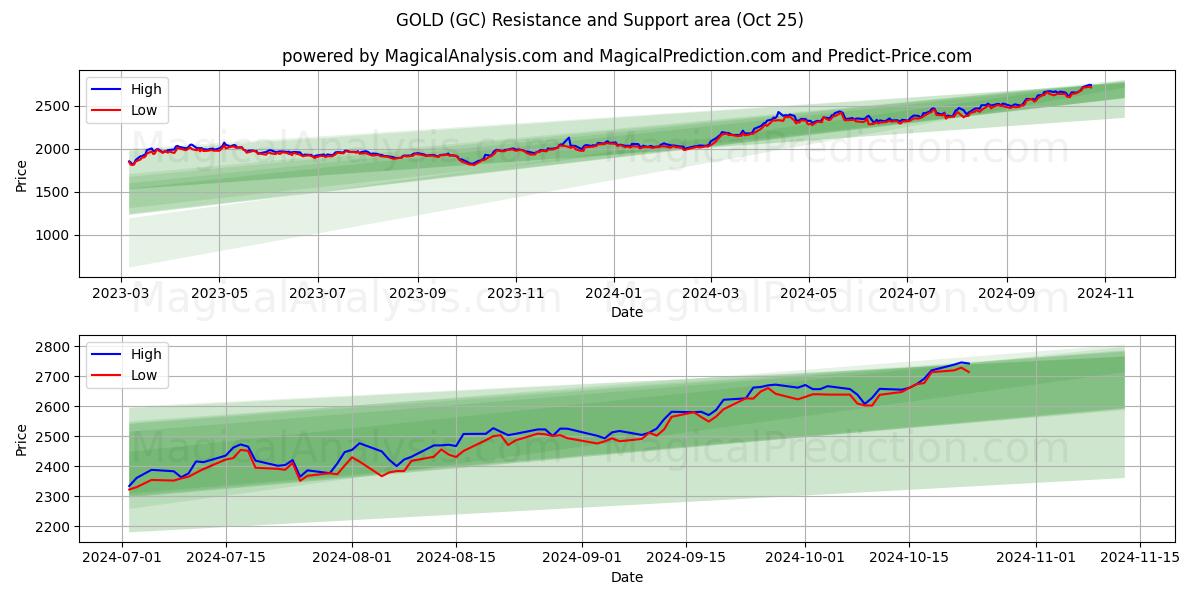
GC
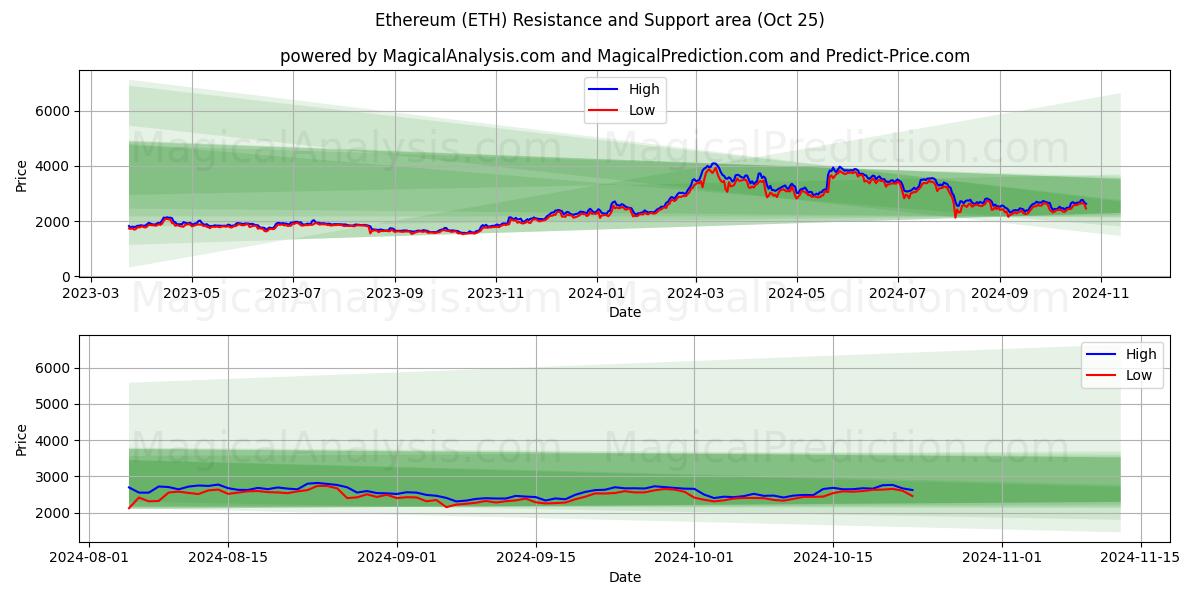
ETH
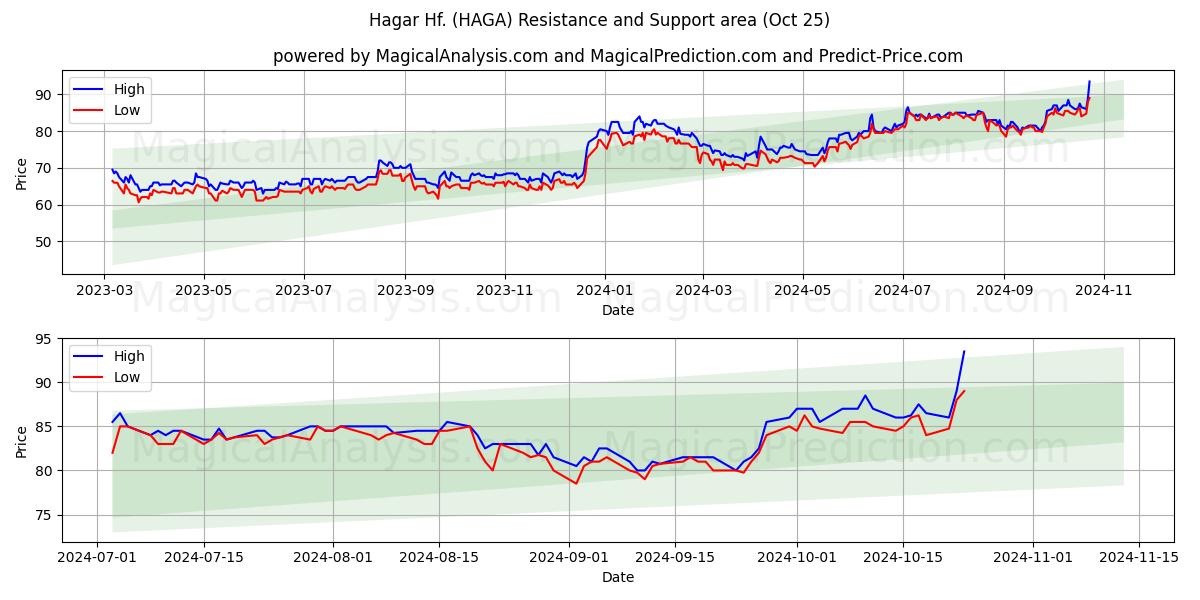
HAGA
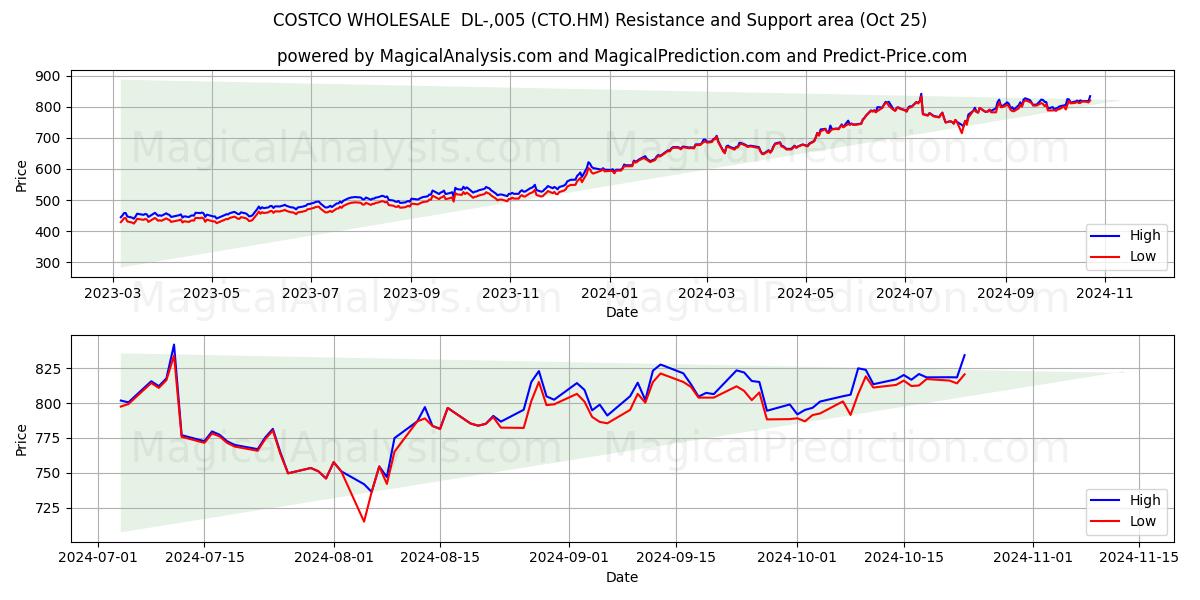
CTO.HM
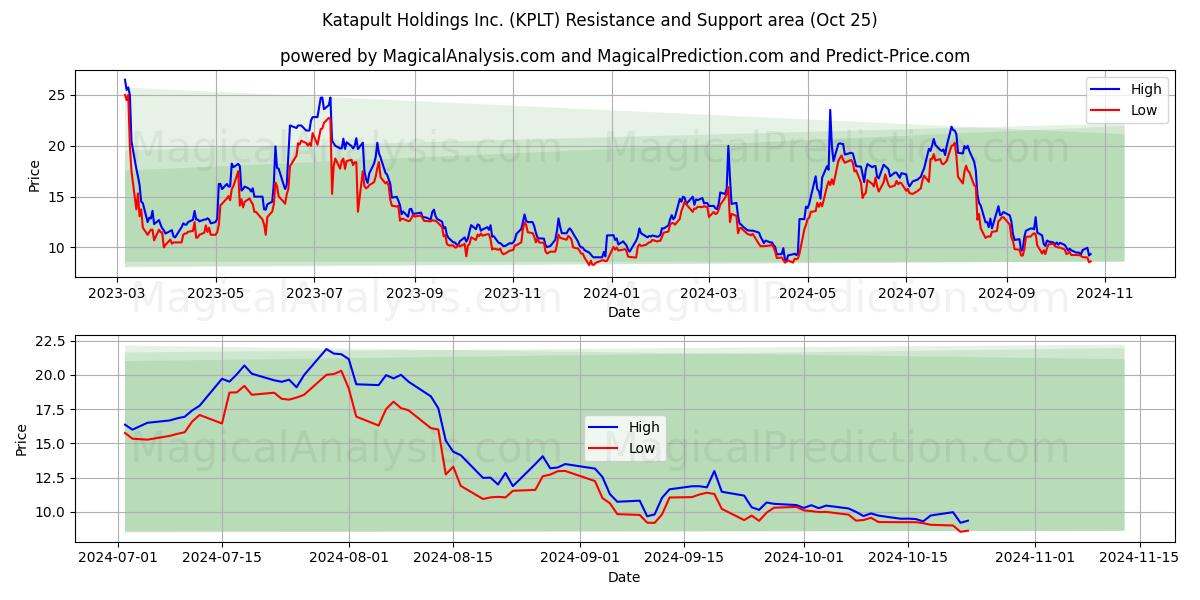
KPLT
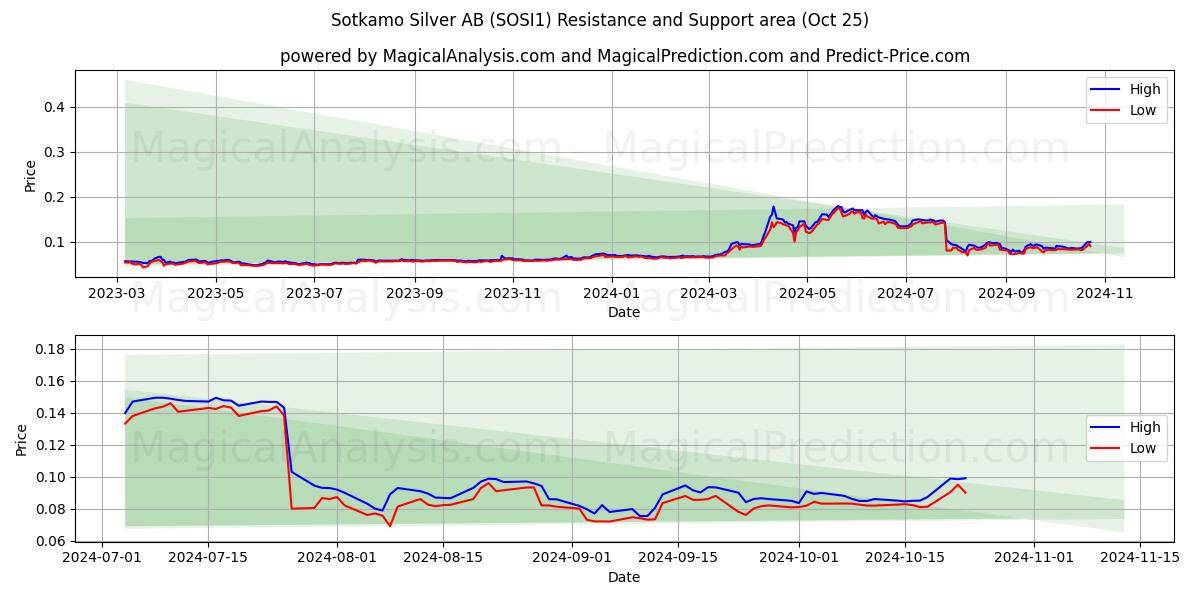
SOSI1
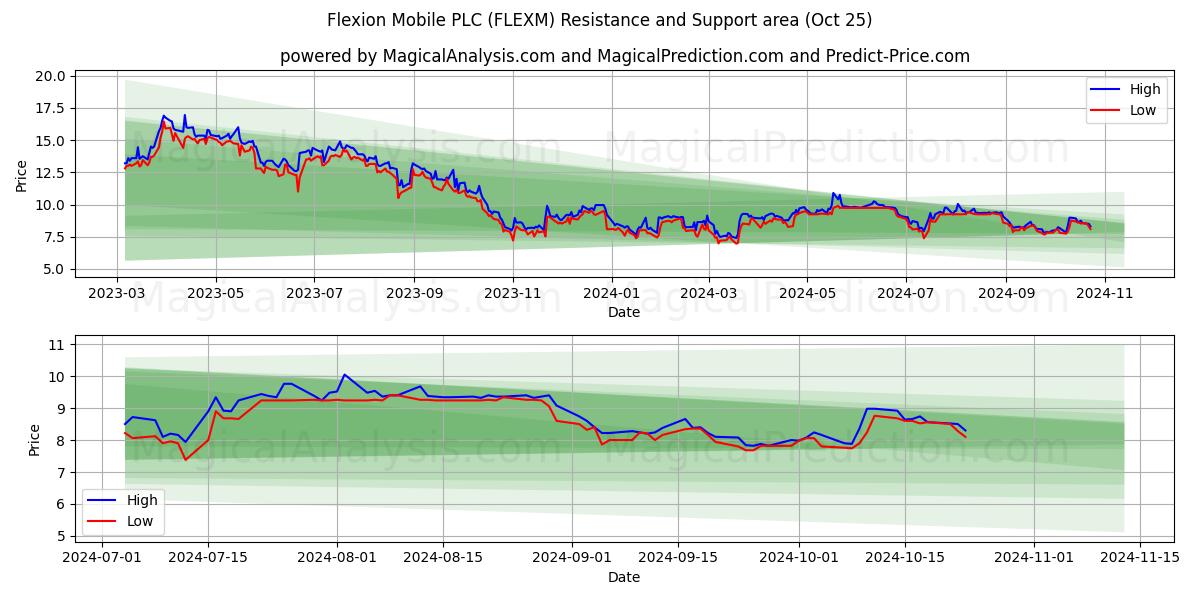
FLEXM
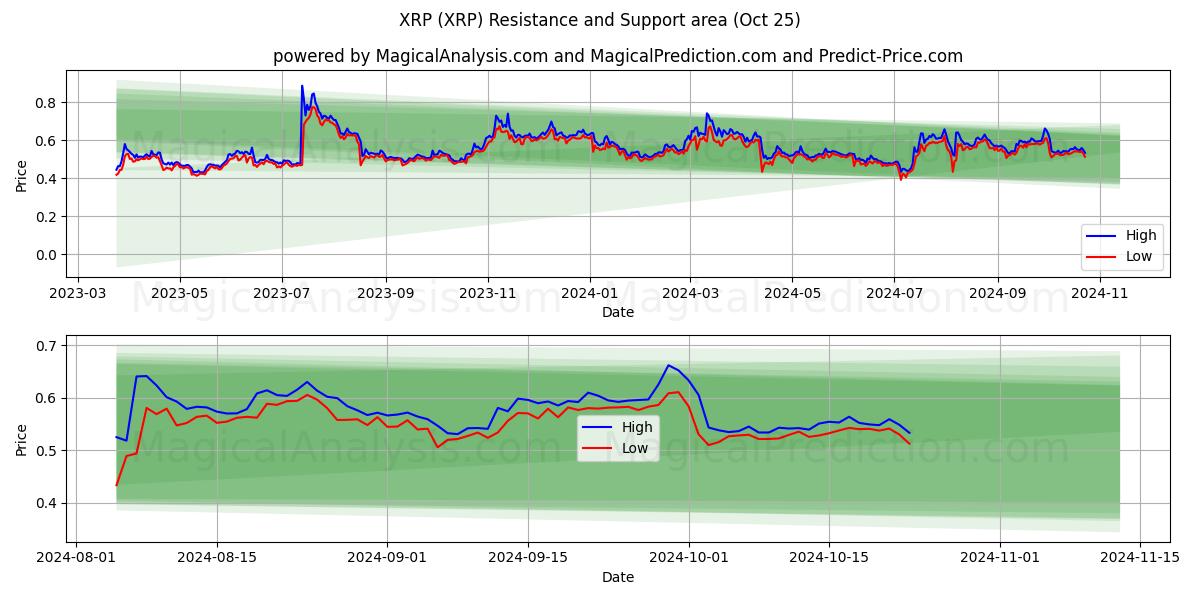
XRP
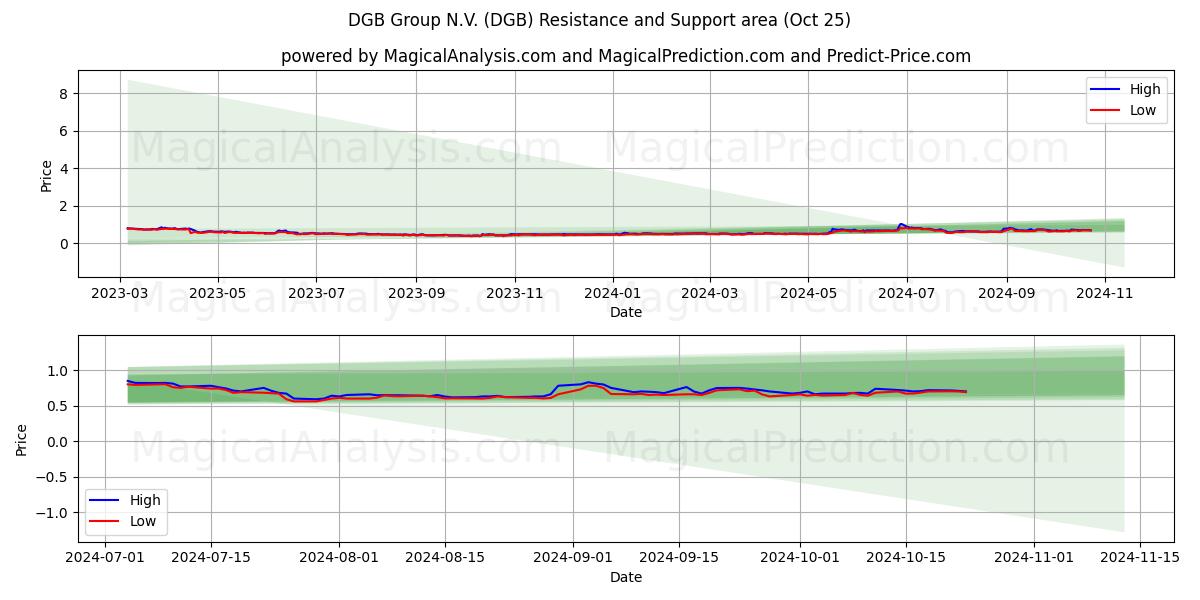
DGB
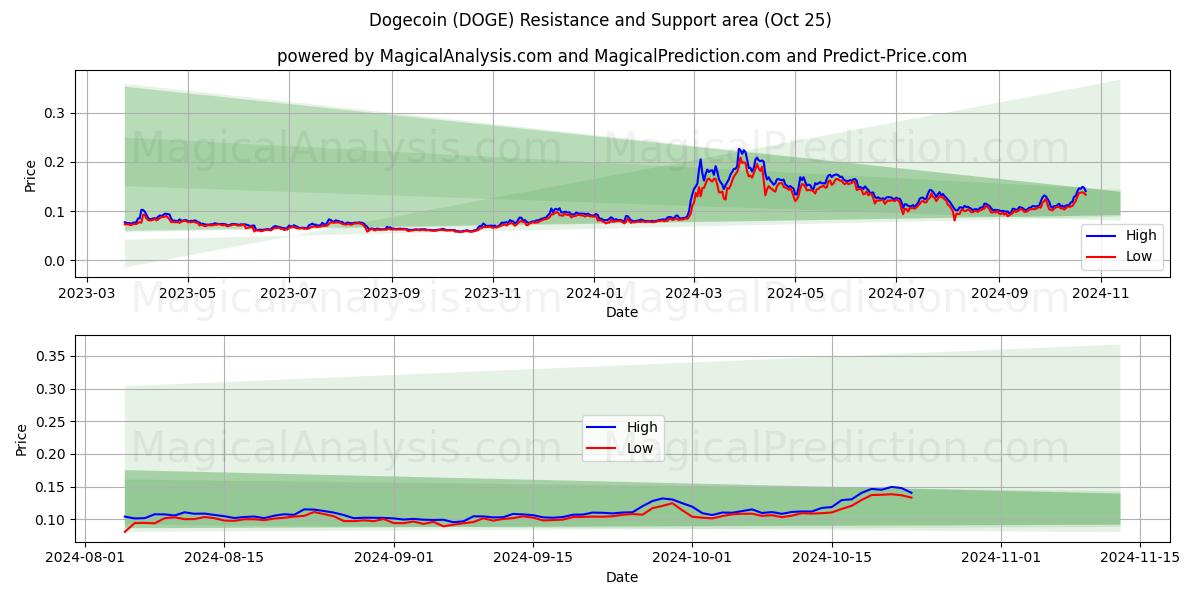
DOGE
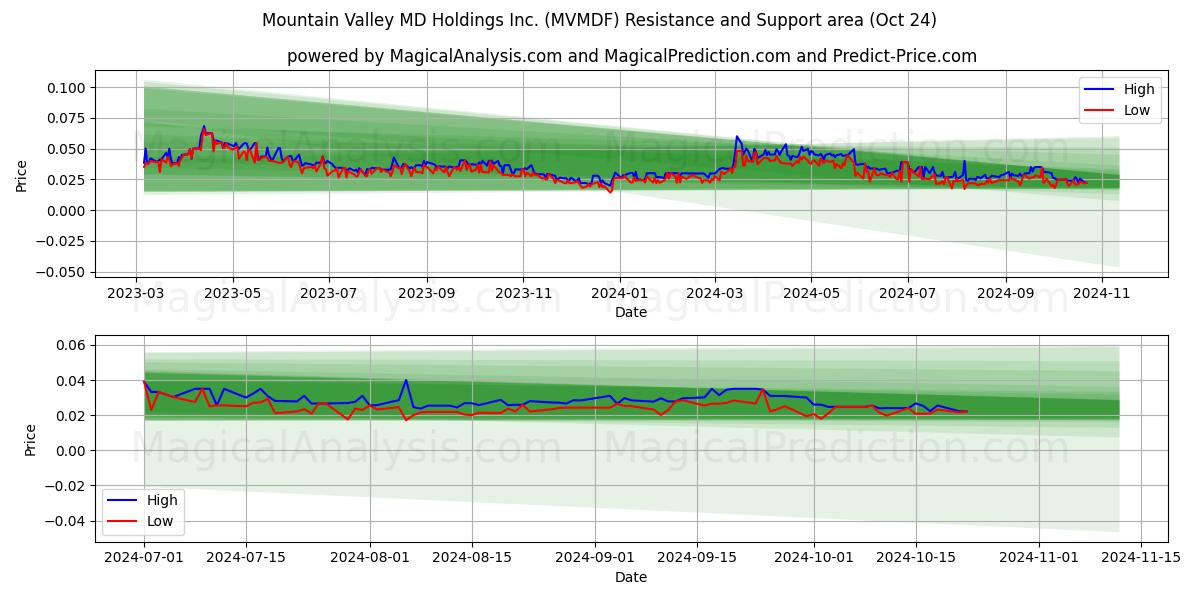
MVMDF
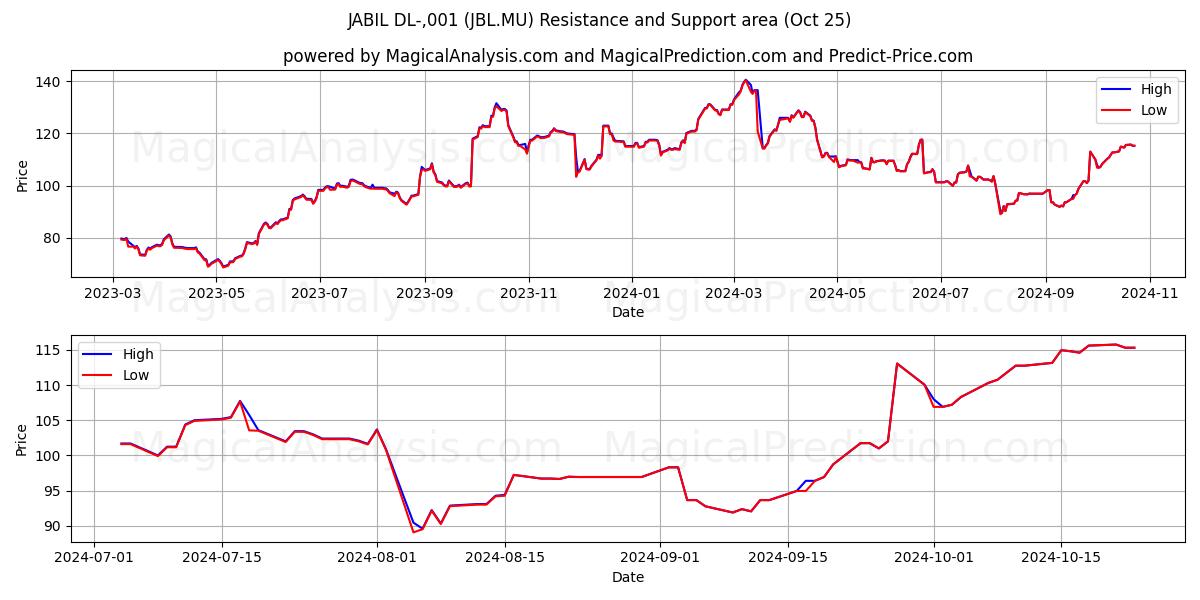
JBL.MU
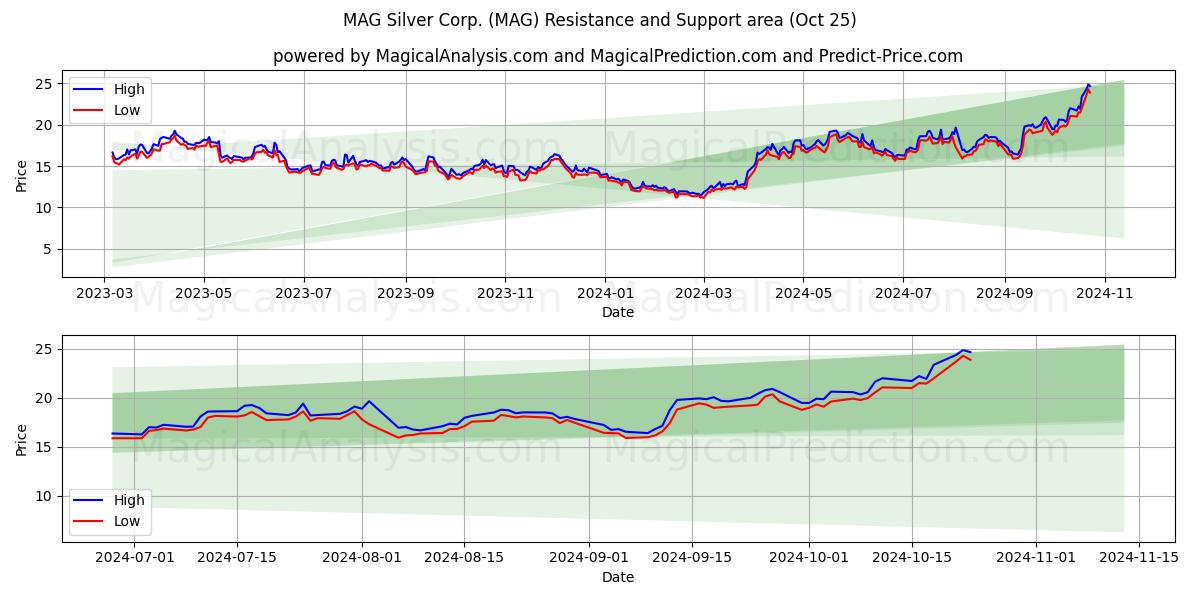
MAG
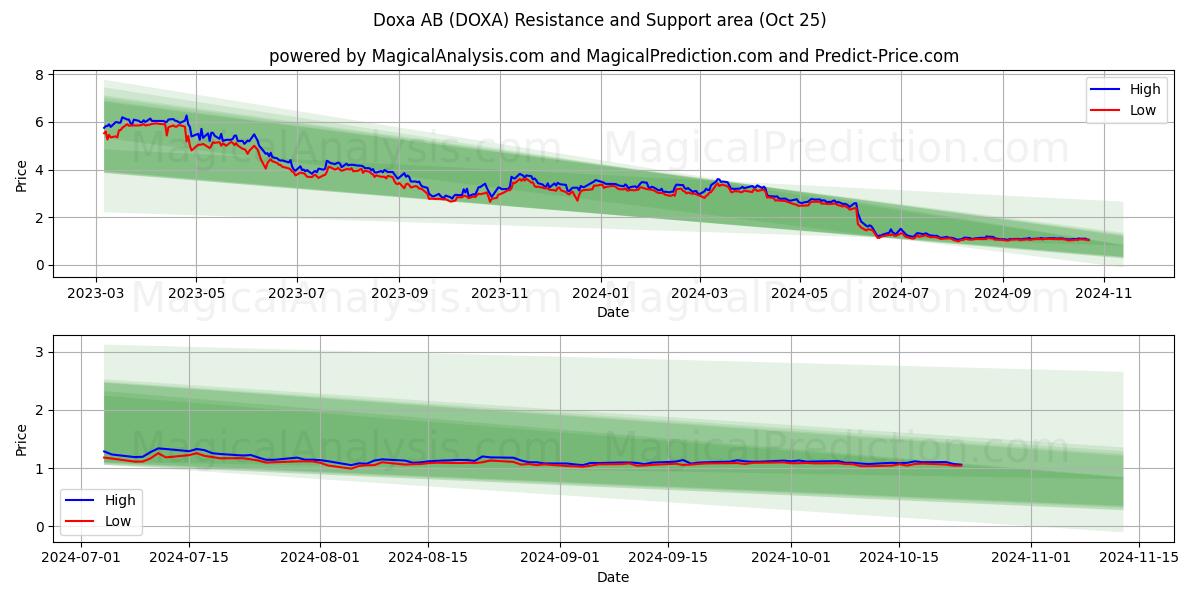
DOXA
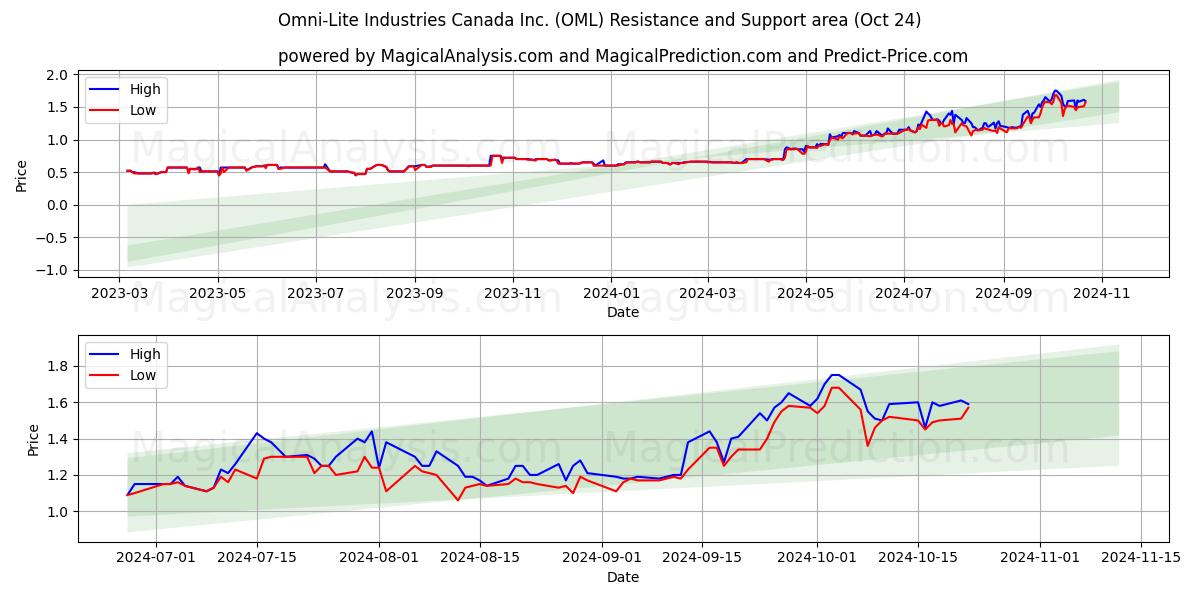
OML
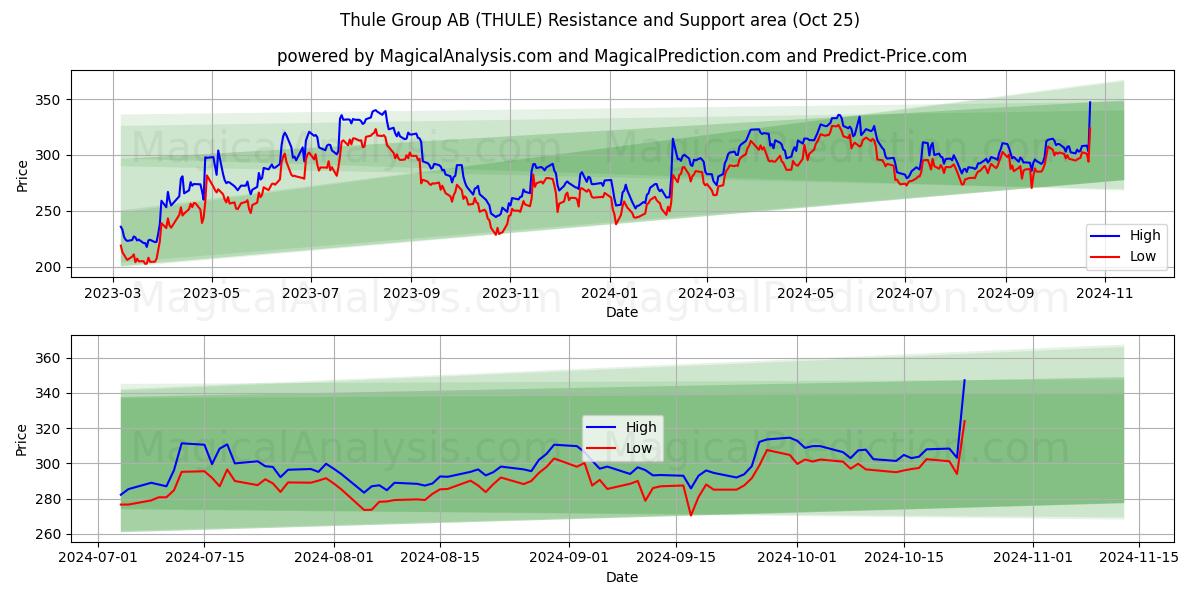
THULE
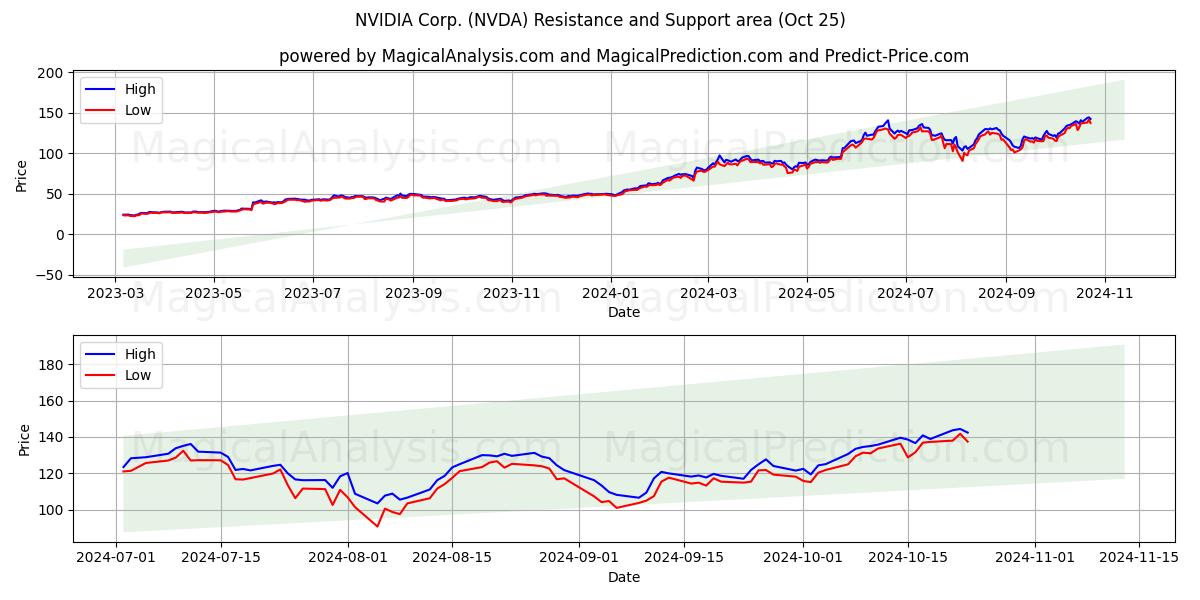
NVDA
Loading
Your prediction has been successfully registered.
Your comment has been successfully registered.
Your prediction for this case has been registered
Your comment has not been posted. Please try again later.