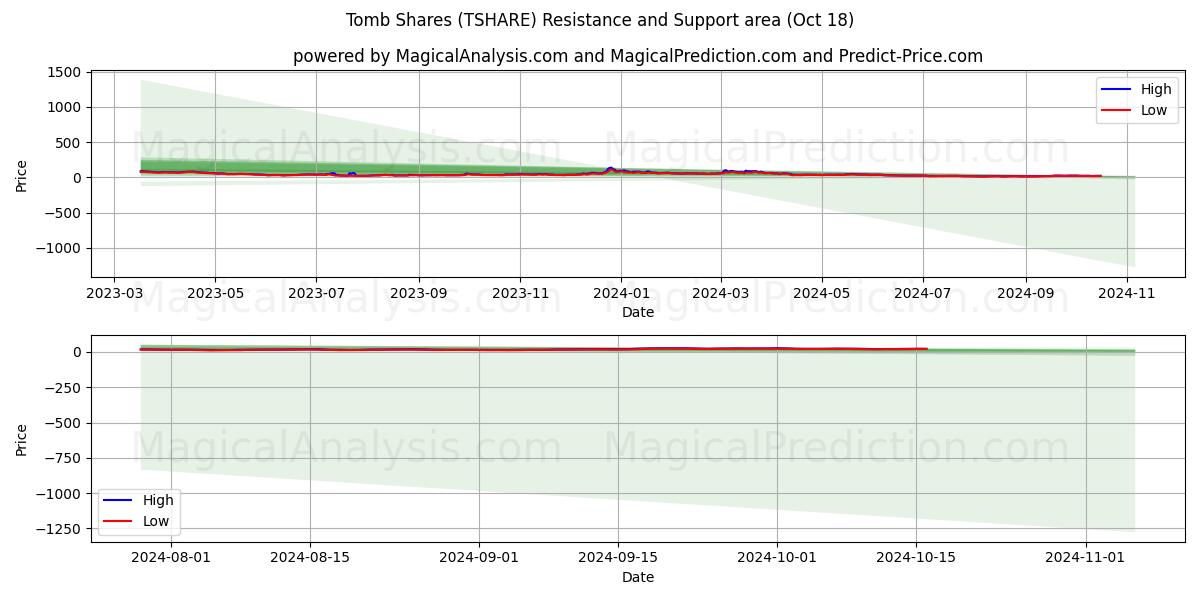
/
18 Oct /
/
/USD
/
CCC/--
| Level1 | Level2 | Level3 | Level4 | Level5 | |
|---|---|---|---|---|---|
| 27.326 | 28.428 | 30.41 | 30.918 | 47.462 | |
| 19.376 | 19.137 | 18.747 | 15.746 | 12.249 |

| Overall Signals |
|---|
| Signal 1 | Signal 2 |
|---|---|
| Signal 3 | Signal 4 |
|---|---|
Today's Tomb Shares (TSHARE) Candle Patterns List:
Hikkake Pattern Short Line Candle
| # | Date | Overal Signals | ALL Signals |
|---|---|---|---|
| 1 | 17 Oct | Sell | SellSellHoldHold |
| 2 | 16 Oct | Sell | HoldNeutralHoldSell |
| 3 | 15 Oct | Hold | HoldBuyHoldNeutral |
| 4 | 14 Oct | Buy | BuyHoldHoldHold |
| 5 | 13 Oct | Sell | SellHoldHoldHold |
| 6 | 12 Oct | Hold | NeutralHoldHoldHold |
| 7 | 11 Oct | Hold | HoldHoldHoldHold |
| 8 | 10 Oct | Hold | HoldHoldHoldHold |
| 9 | 09 Oct | Sell | SellHoldSellSell |
| 10 | 08 Oct | Hold | NeutralSellNeutralNeutral |
| 11 | 07 Oct | Hold | NeutralNeutralNeutralNeutral |
| 12 | 06 Oct | Hold | NeutralHoldNeutralNeutral |
| 13 | 05 Oct | Hold | HoldHoldNeutralNeutral |
| 14 | 04 Oct | Hold | HoldHoldHoldNeutral |
| 15 | 03 Oct | Sell | HoldSellSellSell |
| 16 | 02 Oct | Buy | HoldNeutralBuyHold |
| 17 | 01 Oct | Sell | SellNeutralNeutralHold |
| 18 | 30 Sep | Hold | NeutralBuyNeutralHold |
| 19 | 29 Sep | Hold | HoldNeutralHoldHold |
| 20 | 28 Sep | Hold | HoldNeutralHoldHold |
| 21 | 27 Sep | Buy | BuyNeutralHoldHold |
| 22 | 26 Sep | Buy | NeutralNeutralHoldHold |
| 23 | 25 Sep | Neutral | HoldNeutralHoldHold |
| 24 | 24 Sep | Neutral | HoldNeutralHoldHold |
| 25 | 23 Sep | Sell | SellNeutralHoldHold |
| 26 | 22 Sep | Hold | NeutralHoldHoldHold |
| 27 | 21 Sep | Hold | HoldHoldHoldHold |
| 28 | 20 Sep | Hold | HoldHoldHoldHold |
| 29 | 19 Sep | Hold | HoldHoldHoldHold |
| 30 | 18 Sep | Hold | HoldHoldHoldHold |
In this section, you can easily predict without user registration. See also other users predictions.
